
New search
Property profile & analytics
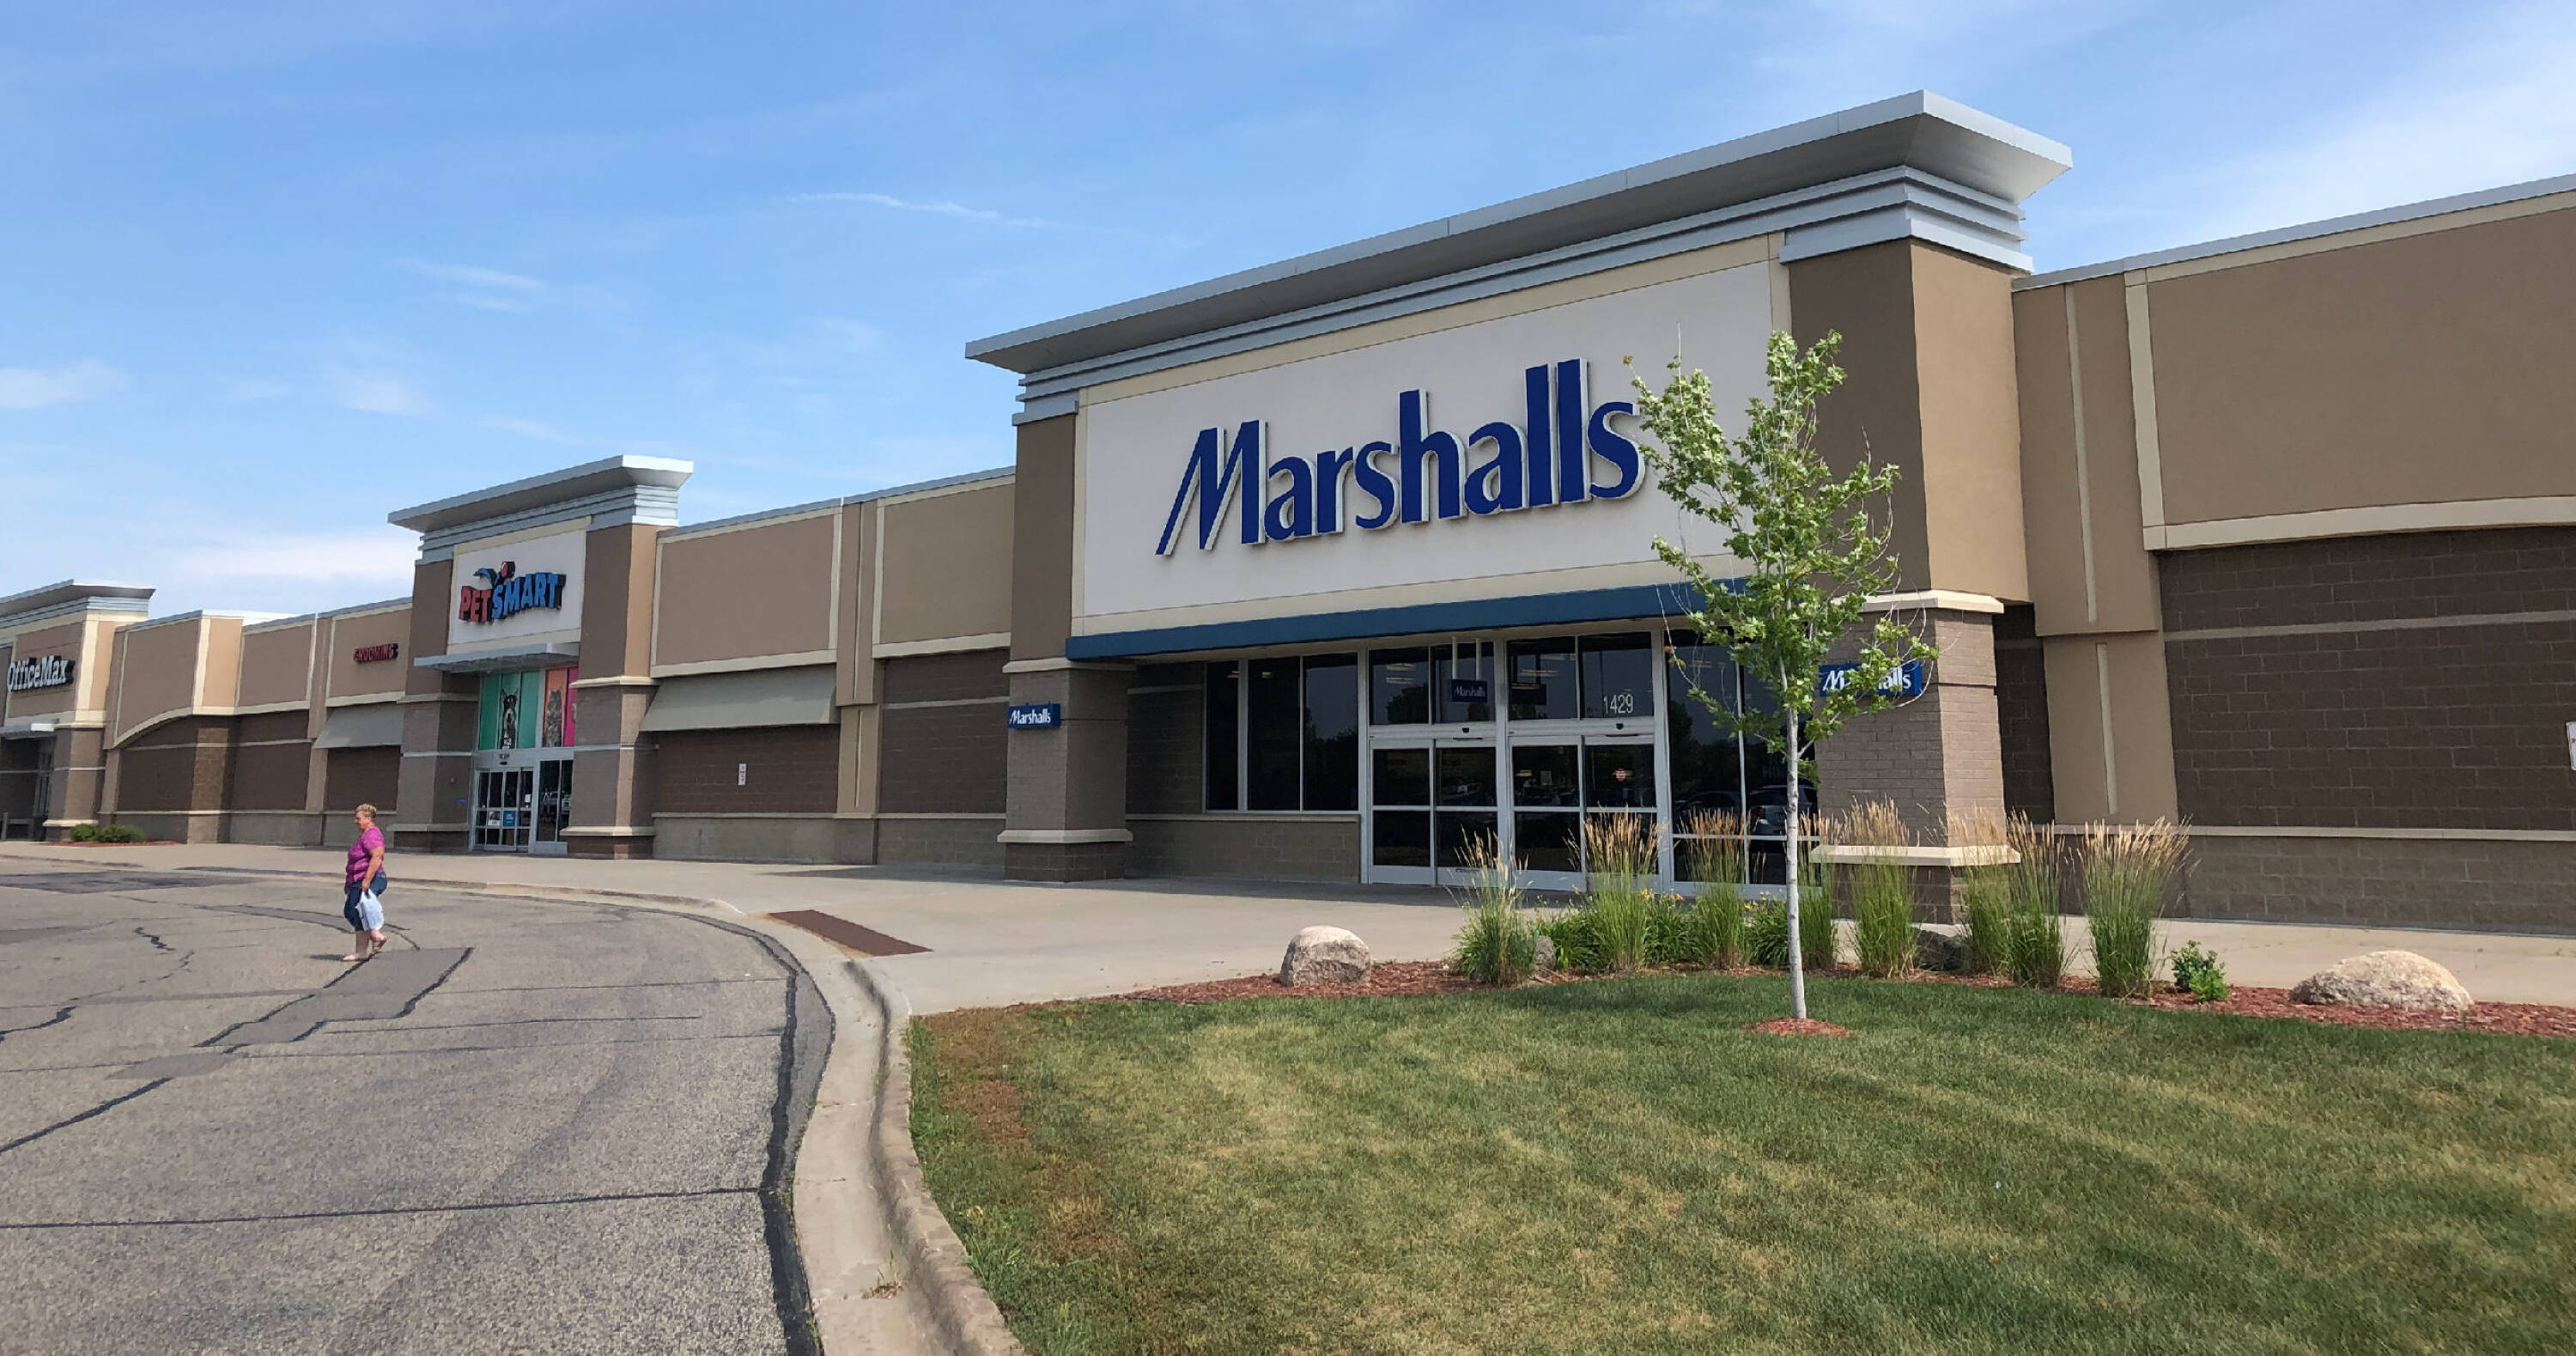
FOR LEASE
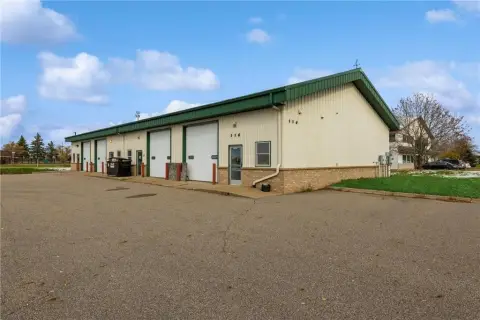
Retail space
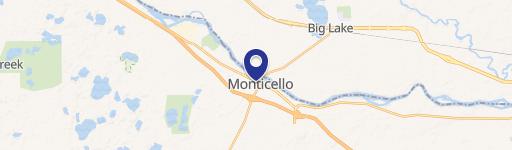
1417 E 7Th St, Monticello, MN 55362
Entity Owned
6-yr Hold
Free & Clear
Property ID
US46-1157999
 For Lease
1 / 4
For Lease
1 / 4
$4,720,000
1417 E 7Th St, Monticello, MN 55362
View Listing →
Property profile
Verified
Property type
Retail space
Use group
RETAIL STORES (PERSONAL SERVICES)
Year built
2007
Construction
MASONRY/CONCRETE MASONRY UNITS (CMUS)
Total area
14,507 SF
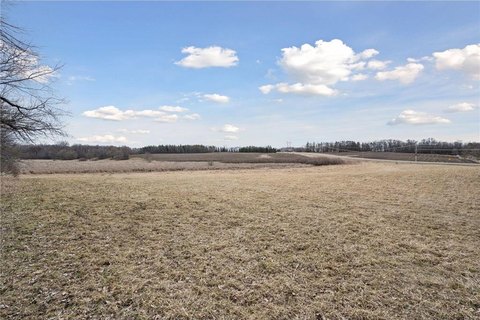
Lot
1.53 ac (66,647 SF)
APN
155-216-001010
UPID
US46-1157999
Cap rate & NOI
Priority signal for investors
Implied cap rate, NOI & suggested price
Cap rate vs submarket · NOI estimate · 3 price anchors
Implied cap rate, NOI & suggested price
Cap vs submarket · NOI estimate · 3 price anchors
Current use
Occupant on record · Public records
-
Five Below (Bike/Boat/Book/etc) Store
Value estimations
Realmo proprietary · 4 methods
AI Approach
AI
$4.32M
CAP Approach
CAP
by Request
Comparable Approach
Comparable
by Request
Blend (final)
Blend
$4.72M
Owner & transaction history
Ax Tc Retail LP · 6 yrs held
Ax Tc Retail LP
since 2020
Last sale
$5.0M
7 recorded transactions
Zoning & alternative use
Permitted uses
Permitted uses
Allowed · conditional · prohibited
Cap rate
Implied · in-place · derived from last sale + estimated NOI
Implied Cap rate
#1
Implied · in-place · NOI ÷ last sale
In-place · derived from last sale + estimated NOI
Cap rate, NOI & submarket benchmark
Implied cap rate vs Monticello submarket · NOI estimate · Typical band, median & reading
Implied cap rate, NOI & submarket benchmark
Cap vs Monticello submarket · NOI estimate · typical band, median & reading
Refine your cap rate
8-question underwriting flow
1.
Property current status — Going-In vs Stabilized
2.
Price for denominator — asking / offer / market
3.
Leasing status & lease structure (NNN / Gross)
4.
Tenant risk profile & vacancy assumption
5.
Upload T12 / rent roll / OM (optional)
Refine in 60 seconds, get exact suggested price
T12 upload · Submarket benchmarks · Sensitivity grid
Suggested price · 3 cap rate anchors
Income approach @ 5% / 7% / 9% — aggressive / typical / conservative
Suggested price at 5% / 7% / 9% cap
Aggressive / typical / conservative · Implied $/SF per anchor · Sensitivity grid
Suggested price at 5% / 7% / 9% cap
Aggressive / typical / conservative · implied $/SF · sensitivity
Value
AI, CAP & Alternative Use estimations · Realmo proprietary blendValue Estimations
Based on Realmo’s proprietary methodology
AI Approach
Method
Estimation
Statistic approach
$4,565,000
ML approach
$4,320,000
CAP Approach
CAP Return
Estimation
6%
by Request
6.5%
by Request
7%
by Request
Blend value · Realmo final
$4.72M
Range $4.25M – $5.19M · ±10% · vs last sale $5.00M (Jan 30 2020)
Last sale anchor
$5.00M
Jan 30 2020
Realmo estimate · informational only.
These numbers are calculated by our models from public records and may not reflect actual market value.
Not an appraisal.
Verify with a licensed appraiser before transacting. Realmo accepts no liability for divergence from real-world outcomes.
View the full estimation — every method, every assumption
Confidence drivers & risk notes · Custom comparable set · Free for first 3 / day
Full estimation methodology
Every method · every assumption · confidence drivers
Price per SF
Sale + rent benchmarks
Subject property
$325 / SF
Submarket sale & rent benchmarks
Median sale $/SF · Asking & closed rent · Submarket vacancy
Submarket sale & rent benchmarks
Median sale $/SF · asking & closed rent · submarket vacancy
Property tax & assessments
Tax year 2023Property tax & assessments
Tax year 2023
Tax billed
$39,572
Tax year 2023
Assessed value
$1,658,900
Assessed 2023
Previous assessed
$1,658,900
+0.0% YoY
Effective rate
2.39%
On assessed value
Assessed land
$738,200
Assessed improvement
$920,700
Land market value
$738,200
Improvement market value
$920,700
Total market value
$1,658,900
Applied tax rate
1,101.0000
Comparables
6 recent transactions · within 1.5 miComparable in this city
6 recent transactions
Comparable in this City


Similar Nearby for Sale


Similar Nearby for Lease


Recent comparable sales
Sale price & price/SF · Sale date & distance · Adjustments & confidence
Recent comparable sales
Sale price & $/SF · sale date & distance · adjustments
Property description
Physical attributes from public recordsBuilding & lot
Public records
Property type
Retail space
Use group
RETAIL STORES (PERSONAL SERVICES)
Status
For Lease
Year built
2007
Construction
MASONRY/CONCRETE MASONRY UNITS (CMUS)
Heating
NONE
Total area
14,507 SF
Lot
1.53 ac (66,647 SF)
APN
155-216-001010
UPID
US46-1157999
Jurisdiction
WRIGHT
Zoning & alternative use
Zoning · permitted uses
Permitted & conditional uses
Allowed uses · Special-permit conditions · Prohibited uses
Permitted & conditional uses
Allowed · special-permit conditions · prohibited
Building & site characteristics
From public records
Year built
2007
Construction
MASONRY/CONCRETE MASONRY UNITS (CMUS)
Heating
NONE
Lot
1.53 ac
Current owner
From public records · entity-resolved
Ax Tc Retail LP
Entity
Free & Clear · 6 yrs held
Mailing address
3060 PEACHTREE RD NW STE #400, ATLANTA, GA 30305-2239
Ownership since
2020
Owner contacts — direct phone, email, and related entities
Decision-maker phone · Verified email · Related entities & filings
Owner contacts
Email · phone · related entities
Sales History
7 recorded events · public records
Date
Price
Buyer
Seller
Deed Type
Mortgage
Jun 20, 2025
—
Haza Props LLC
—
Deed
related
$103,600,000 · Synovus Bank
Jan 30, 2020
$5,000,000
Ax Tc Retail LP
James Green
Limited Warranty Deed
—
Dec 1, 2016
—
Ax Tc Retail LP
—
Deed
related
$21,280,800 · Bank Of America
Aug 29, 2014
—
Ax Tc Retail LP
—
Loan Modification
related
$22,678,000 · Bank Of America
Jun 21, 2011
$7,861,842
Ax Tc Retail LP
Ryan Companies Us INC
Warranty Deed
—
Mar 29, 2011
—
Ryan Companies Us INC
—
Deed Of Trust
related
$11,550,000 · M & I Marshall & Isley Bank
—
—
Ax Tc Retail LP
—
Loan Modification
related
$21,280,800 · Bank Of America
Coming soon
Costs & Benchmarks
Operating expenses, capex projections, utility benchmarks, and submarket comparables — all in one view.
Coming soon
Risks
Flood, climate, environmental, title, and tenant-concentration risk — surfaced with mitigations and source citations.
Try Rey
Ask anything about this address in plain English.
“Is 15.6% cap rate sustainable?” · “Best tenant mix for BU1?” · “What’s the redev upside?”
Full reports are paid
Unlock the full Property Analytics report
Start free for 7 days — no card required. Full owner contacts, all 4 valuations with methodology, refine flow, comparable adjustments, foot-traffic deep dive, export to PDF / CSV.


