
New search
Property profile & analytics
OFF-MARKET
Estimated value
$1,200,000
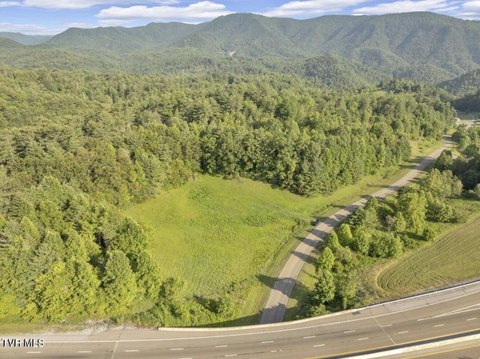
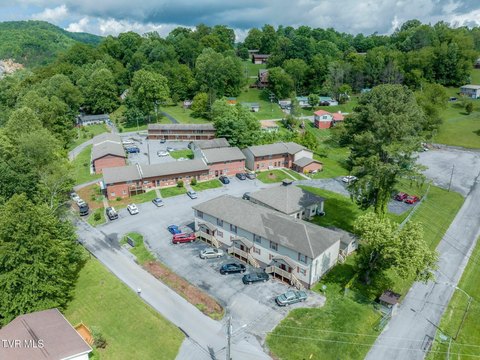
Manufacturing properties
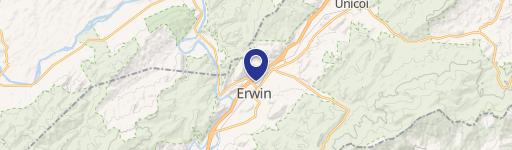
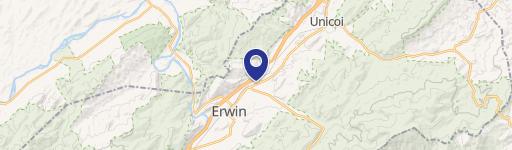
112 Giles Morrill Ln, Erwin, TN 37650-4517
Entity Owned
4-yr Hold
Absentee Owner
~
Est. High Equity
Property ID
US80-1729435
Property profile
Verified
Property type
Manufacturing properties
Use group
MANUFACTURING (LIGHT)
Year built
1965
Construction
FRAME
Total area
28,202 SF
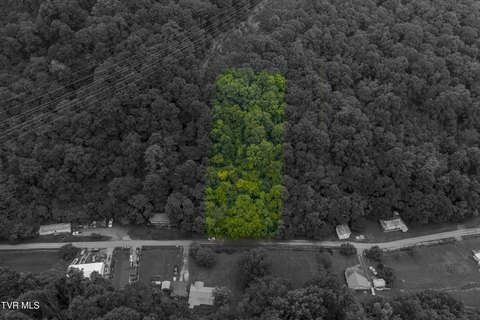
Lot
12.32 ac (536,659 SF)
APN
086038 03600
UPID
US80-1729435
Cap rate & NOI
Priority signal for investors
Implied cap rate, NOI & suggested price
Cap rate vs submarket · NOI estimate · 3 price anchors
Implied cap rate, NOI & suggested price
Cap vs submarket · NOI estimate · 3 price anchors
Current use
Occupant on record · Public records
-
FedUp Foods Food Processing Plant
Value estimations
Realmo proprietary · 4 methods
AI Approach
AI
$1.29M
CAP Approach
CAP
by Request
Comparable Approach
Comparable
by Request
Blend (final)
Blend
$1.20M
Owner & transaction history
Buchi Holdings LLC · 4 yrs held
Buchi Holdings LLC
since 2022
Last sale
$1.2M
3 recorded transactions
Zoning & alternative use
Permitted uses
Permitted uses
Allowed · conditional · prohibited
Cap rate
Implied · in-place · derived from last sale + estimated NOI
Implied Cap rate
#1
Implied · in-place · NOI ÷ last sale
In-place · derived from last sale + estimated NOI
Cap rate, NOI & submarket benchmark
Implied cap rate vs Erwin submarket · NOI estimate · Typical band, median & reading
Implied cap rate, NOI & submarket benchmark
Cap vs Erwin submarket · NOI estimate · typical band, median & reading
Refine your cap rate
8-question underwriting flow
1.
Property current status — Going-In vs Stabilized
2.
Price for denominator — asking / offer / market
3.
Leasing status & lease structure (NNN / Gross)
4.
Tenant risk profile & vacancy assumption
5.
Upload T12 / rent roll / OM (optional)
Refine in 60 seconds, get exact suggested price
T12 upload · Submarket benchmarks · Sensitivity grid
Suggested price · 3 cap rate anchors
Income approach @ 5% / 7% / 9% — aggressive / typical / conservative
Suggested price at 5% / 7% / 9% cap
Aggressive / typical / conservative · Implied $/SF per anchor · Sensitivity grid
Suggested price at 5% / 7% / 9% cap
Aggressive / typical / conservative · implied $/SF · sensitivity
Value
AI, CAP & Alternative Use estimations · Realmo proprietary blendValue Estimations
Based on Realmo’s proprietary methodology
AI Approach
Method
Estimation
Statistic approach
$1,205,000
ML approach
$1,290,000
CAP Approach
CAP Return
Estimation
6%
by Request
6.5%
by Request
7%
by Request
Alternative Use
Use
Estimation
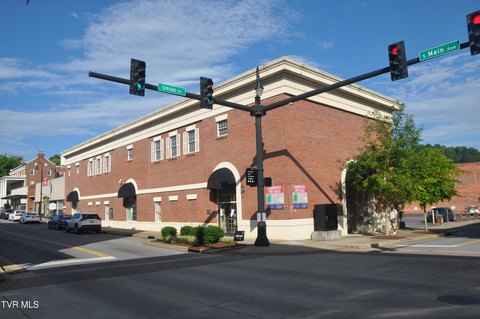
RETAIL STORES
$1,520,000
Change: 0% · Conversion: Moderate
Blend value · Realmo final
$1.20M
Range $1.08M – $1.32M · ±10% · vs last sale $1.15M (Sep 28 2021)
Last sale anchor
$1.15M
Sep 28 2021
Realmo estimate · informational only.
These numbers are calculated by our models from public records and may not reflect actual market value.
Not an appraisal.
Verify with a licensed appraiser before transacting. Realmo accepts no liability for divergence from real-world outcomes.
View the full estimation — every method, every assumption
Confidence drivers & risk notes · Custom comparable set · Free for first 3 / day
Full estimation methodology
Every method · every assumption · confidence drivers
Price per SF
Sale + rent benchmarks
Subject property
$43 / SF
Submarket sale & rent benchmarks
Median sale $/SF · Asking & closed rent · Submarket vacancy
Submarket sale & rent benchmarks
Median sale $/SF · asking & closed rent · submarket vacancy
Property tax & assessments
Property tax & assessments
Assessed value
$599,200
Assessed 2023
Previous assessed
$582,640
+2.8% YoY
Assessed land
$69,600
Assessed improvement
$529,600
Land market value
$174,000
Improvement market value
$1,324,000
Total market value
$1,498,000
Applied tax rate
86.0000
Comparables
6 recent transactions · within 1.5 miComparable in this city
6 recent transactions
Comparable in this City


Similar Nearby for Sale

Similar Nearby for Lease


Recent comparable sales
Sale price & price/SF · Sale date & distance · Adjustments & confidence
Recent comparable sales
Sale price & $/SF · sale date & distance · adjustments
Property description
Physical attributes from public recordsBuilding & lot
Public records
Property type
Manufacturing properties
Use group
MANUFACTURING (LIGHT)
Status
Off-Market
Year built
1965
Construction
FRAME
Heating
YES
Cooling
AC.PACKAGE
Buildings
4
Stories
1
Units
1
Bathrooms
6
Total area
28,202 SF
Lot
12.32 ac (536,659 SF)
APN
086038 03600
UPID
US80-1729435
Jurisdiction
UNICOI
Zoning & alternative use
Zoning · permitted uses
Permitted & conditional uses
Allowed uses · Special-permit conditions · Prohibited uses
Permitted & conditional uses
Allowed · special-permit conditions · prohibited
Alternative use value scenarios
Repositioning upside vs current use
RETAIL STORES
Est. value
$1.5M
RETAIL STORES
Alternative use deep dive — conversion cost, permits, timeline
Conversion cost estimate · Permit path & risks · Stabilized NOI per option
Alternative use deep dive
Conversion cost · permit path · stabilized NOI per option
Building & site characteristics
From public records
Year built
1965
Construction
FRAME
Heating
YES
Cooling
Yes
Stories
1
Buildings
4
Units
1
Bathrooms
6
Lot
12.32 ac
Current owner
From public records · entity-resolved
Buchi Holdings LLC
Entity
Mailing address
242 DERRINGER DR, MARSHALL, NC 28753-8909
Mailing matches property
Different — outreach signal
Owner-occupied
No
Ownership since
2022
Owner contacts — direct phone, email, and related entities
Decision-maker phone · Verified email · Related entities & filings
Owner contacts
Email · phone · related entities
Sales History
3 recorded events · public records
Date
Price
Buyer
Seller
Deed Type
Mortgage
Dec 19, 2025
—
Buchi Holdings LLC
—
Deed
related
$6,589,790 · First Bank
Apr 29, 2022
$1,150,000
Buchi Holdings LLC
Giles Erwin LLC
Special Warranty Deed
$3,200,000 · First Bank
Sep 28, 2021
$610,000
112giles Erwin LLC
Regal Beloit America INC
Special Warranty Deed
—
Coming soon
Costs & Benchmarks
Operating expenses, capex projections, utility benchmarks, and submarket comparables — all in one view.
Coming soon
Risks
Flood, climate, environmental, title, and tenant-concentration risk — surfaced with mitigations and source citations.
Try Rey
Ask anything about this address in plain English.
“Is 15.6% cap rate sustainable?” · “Best tenant mix for BU1?” · “What’s the redev upside?”
You own 112 Giles Morrill Ln?
List it free. Reach 20,000 daily buyers.
We’ve already pulled the facts. Confirm photos + price and you’re live in 2 minutes.
List this address →
Full reports are paid
Unlock the full Property Analytics report
Start free for 7 days — no card required. Full owner contacts, all 4 valuations with methodology, refine flow, comparable adjustments, foot-traffic deep dive, export to PDF / CSV.


