
New search
Property profile & analytics
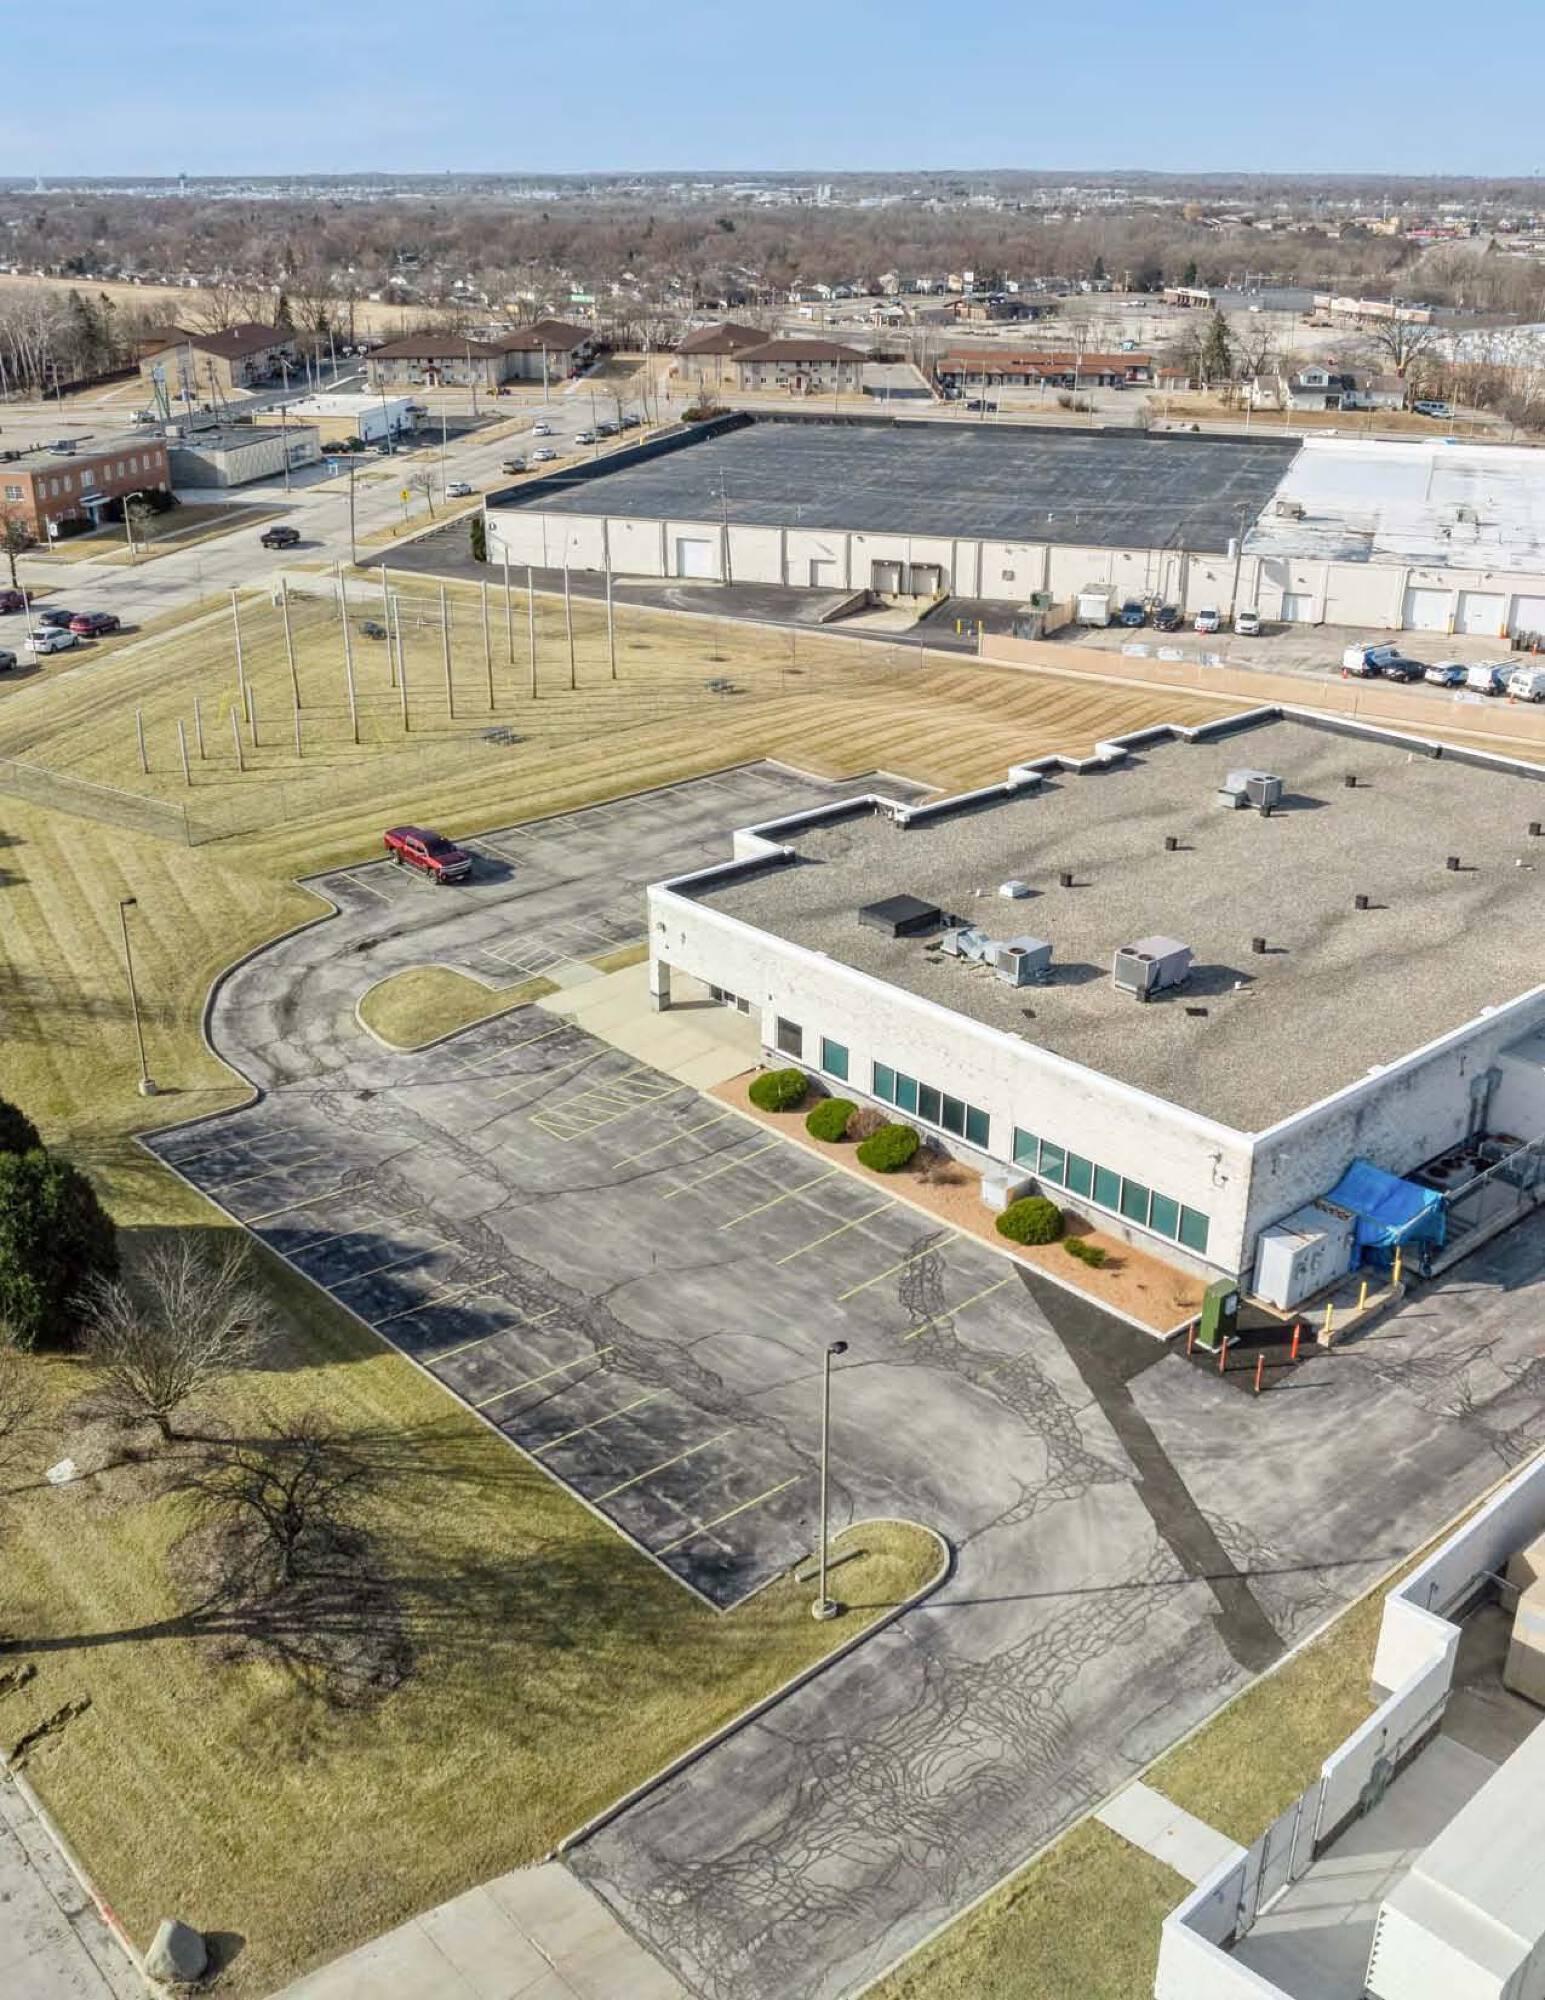
FOR LEASE
Industrial properties
10130 W Appleton Ave, Milwaukee, WI 53225
Entity Owned
Absentee Owner
~
Est. High Equity
Property ID
US92-0109520
 For Lease
1 / 23
For Lease
1 / 23
$3,810,000
10130 W Appleton Ave, Milwaukee, WI 53225
View Listing →
Property profile
Verified
Property type
Industrial properties
Use group
INDUSTRIAL PARK
Year built
1959
Total area
100,800 SF
Lot
7.98 ac (347,565 SF)
Zoning code
LB1
APN
179-9988-111
UPID
US92-0109520
Cap rate & NOI
Priority signal for investors
Implied cap rate, NOI & suggested price
Cap rate vs submarket · NOI estimate · 3 price anchors
Implied cap rate, NOI & suggested price
Cap vs submarket · NOI estimate · 3 price anchors
Current use
Occupant on record · Public records
-
Renal Patient Services Medical Clinic
-
DaVita West Appleton Dialysis Medical Clinic
Value estimations
Realmo proprietary · 4 methods
AI Approach
AI
by Request
CAP Approach
CAP
by Request
Comparable Approach
Comparable
$2.80M
Blend (final)
Blend
$3.81M
Owner & transaction history
Fourth Property LLC
Fourth Property LLC
since 2025
2 recorded transactions
Zoning & alternative use
LB1 · Milwaukee, WI
Permitted uses
Permitted uses
Allowed · conditional · prohibited
Cap rate
Implied · in-place · derived from last sale + estimated NOI
Implied Cap rate
#1
Implied · in-place · NOI ÷ last sale
In-place · derived from last sale + estimated NOI
Cap rate, NOI & submarket benchmark
Implied cap rate vs Milwaukee submarket · NOI estimate · Typical band, median & reading
Implied cap rate, NOI & submarket benchmark
Cap vs Milwaukee submarket · NOI estimate · typical band, median & reading
Refine your cap rate
8-question underwriting flow
1.
Property current status — Going-In vs Stabilized
2.
Price for denominator — asking / offer / market
3.
Leasing status & lease structure (NNN / Gross)
4.
Tenant risk profile & vacancy assumption
5.
Upload T12 / rent roll / OM (optional)
Refine in 60 seconds, get exact suggested price
T12 upload · Submarket benchmarks · Sensitivity grid
Suggested price · 3 cap rate anchors
Income approach @ 5% / 7% / 9% — aggressive / typical / conservative
Suggested price at 5% / 7% / 9% cap
Aggressive / typical / conservative · Implied $/SF per anchor · Sensitivity grid
Suggested price at 5% / 7% / 9% cap
Aggressive / typical / conservative · implied $/SF · sensitivity
Value
AI, CAP & Alternative Use estimations · Realmo proprietary blendValue Estimations
Based on Realmo’s proprietary methodology
AI Approach
Method
Estimation
Statistic approach
by Request
ML approach
by Request
CAP Approach
CAP Return
Estimation
6%
by Request
6.5%
by Request
7%
by Request
Alternative Use
Use
Estimation
INDUSTRIAL (GENERAL)
$5,485,000
Current use
Blend value · Realmo final
$3.81M
Range $3.43M – $4.19M · ±10%
Realmo estimate · informational only.
These numbers are calculated by our models from public records and may not reflect actual market value.
Not an appraisal.
Verify with a licensed appraiser before transacting. Realmo accepts no liability for divergence from real-world outcomes.
View the full estimation — every method, every assumption
Confidence drivers & risk notes · Custom comparable set · Free for first 3 / day
Full estimation methodology
Every method · every assumption · confidence drivers
Price per SF
Sale + rent benchmarks
Subject property
$38 / SF
Submarket sale & rent benchmarks
Median sale $/SF · Asking & closed rent · Submarket vacancy
Submarket sale & rent benchmarks
Median sale $/SF · asking & closed rent · submarket vacancy
Property tax & assessments
Tax year 2022Property tax & assessments
Tax year 2022
Tax billed
$71,413
Tax year 2022
Assessed value
$2,999,300
Assessed 2022
Previous assessed
$2,999,300
+0.0% YoY
Effective rate
2.38%
On assessed value
Assessed land
$695,100
Assessed improvement
$2,304,200
Land market value
$695,100
Improvement market value
$2,304,200
Total market value
$2,999,300
Applied tax rate
1.0000
Comparables
6 recent transactions · within 1.5 miComparable in this city
6 recent transactions
Comparable in this City


Similar Nearby for Sale


Similar Nearby for Lease


Recent comparable sales
Sale price & price/SF · Sale date & distance · Adjustments & confidence
Recent comparable sales
Sale price & $/SF · sale date & distance · adjustments
Property description
Physical attributes from public recordsBuilding & lot
Public records
Property type
Industrial properties
Use group
INDUSTRIAL PARK
Status
For Lease
Year built
1959
Heating
YES
Cooling
YES
Stories
1
Units
3
Total area
100,800 SF
Lot
7.98 ac (347,565 SF)
Zoning code
LB1
APN
179-9988-111
UPID
US92-0109520
Jurisdiction
MILWAUKEE
Zoning & alternative use
LB1 · Milwaukee, WI
Zoning LB1 · permitted uses
LB1 · Milwaukee, WI
Permitted & conditional uses
Allowed uses · Special-permit conditions · Prohibited uses
Permitted & conditional uses
Allowed · special-permit conditions · prohibited
Milwaukee. Always verify with local authorities before improvements.
Alternative use value scenarios
Repositioning upside vs current use
INDUSTRIAL (GENERAL) Current
Est. value
$5.5M
INDUSTRIAL (GENERAL) Current
Alternative use deep dive — conversion cost, permits, timeline
Conversion cost estimate · Permit path & risks · Stabilized NOI per option
Alternative use deep dive
Conversion cost · permit path · stabilized NOI per option
Building & site characteristics
From public records
Year built
1959
Heating
YES
Cooling
Yes
Stories
1
Units
3
Lot
7.98 ac
Current owner
From public records · entity-resolved
Fourth Property LLC
Entity
Mailing address
413 N 2ND ST STE #100, MILWAUKEE, WI 53203-3110
Mailing matches property
Different — outreach signal
Owner-occupied
No
Ownership since
2025
Owner contacts — direct phone, email, and related entities
Decision-maker phone · Verified email · Related entities & filings
Owner contacts
Email · phone · related entities
Sales History
2 recorded events · public records
Date
Price
Buyer
Seller
Deed Type
Mortgage
Dec 10, 2025
—
Fourth Property LLC
—
Deed
related
$2,500,000 · Spring Bank
Feb 6, 2013
—
Fourth Property LLC
—
Grant Deed
related
$2,281,300 · Spring Bk
Coming soon
Costs & Benchmarks
Operating expenses, capex projections, utility benchmarks, and submarket comparables — all in one view.
Coming soon
Risks
Flood, climate, environmental, title, and tenant-concentration risk — surfaced with mitigations and source citations.
Try Rey
Ask anything about this address in plain English.
“Is 15.6% cap rate sustainable?” · “Best tenant mix for BU1?” · “What’s the redev upside?”
Full reports are paid
Unlock the full Property Analytics report
Start free for 7 days — no card required. Full owner contacts, all 4 valuations with methodology, refine flow, comparable adjustments, foot-traffic deep dive, export to PDF / CSV.


