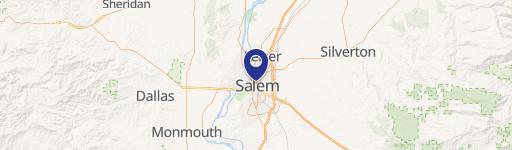
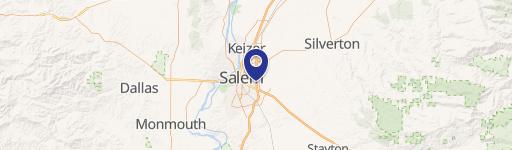
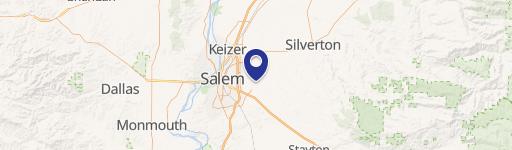
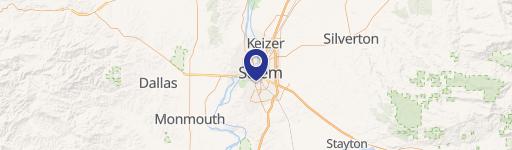
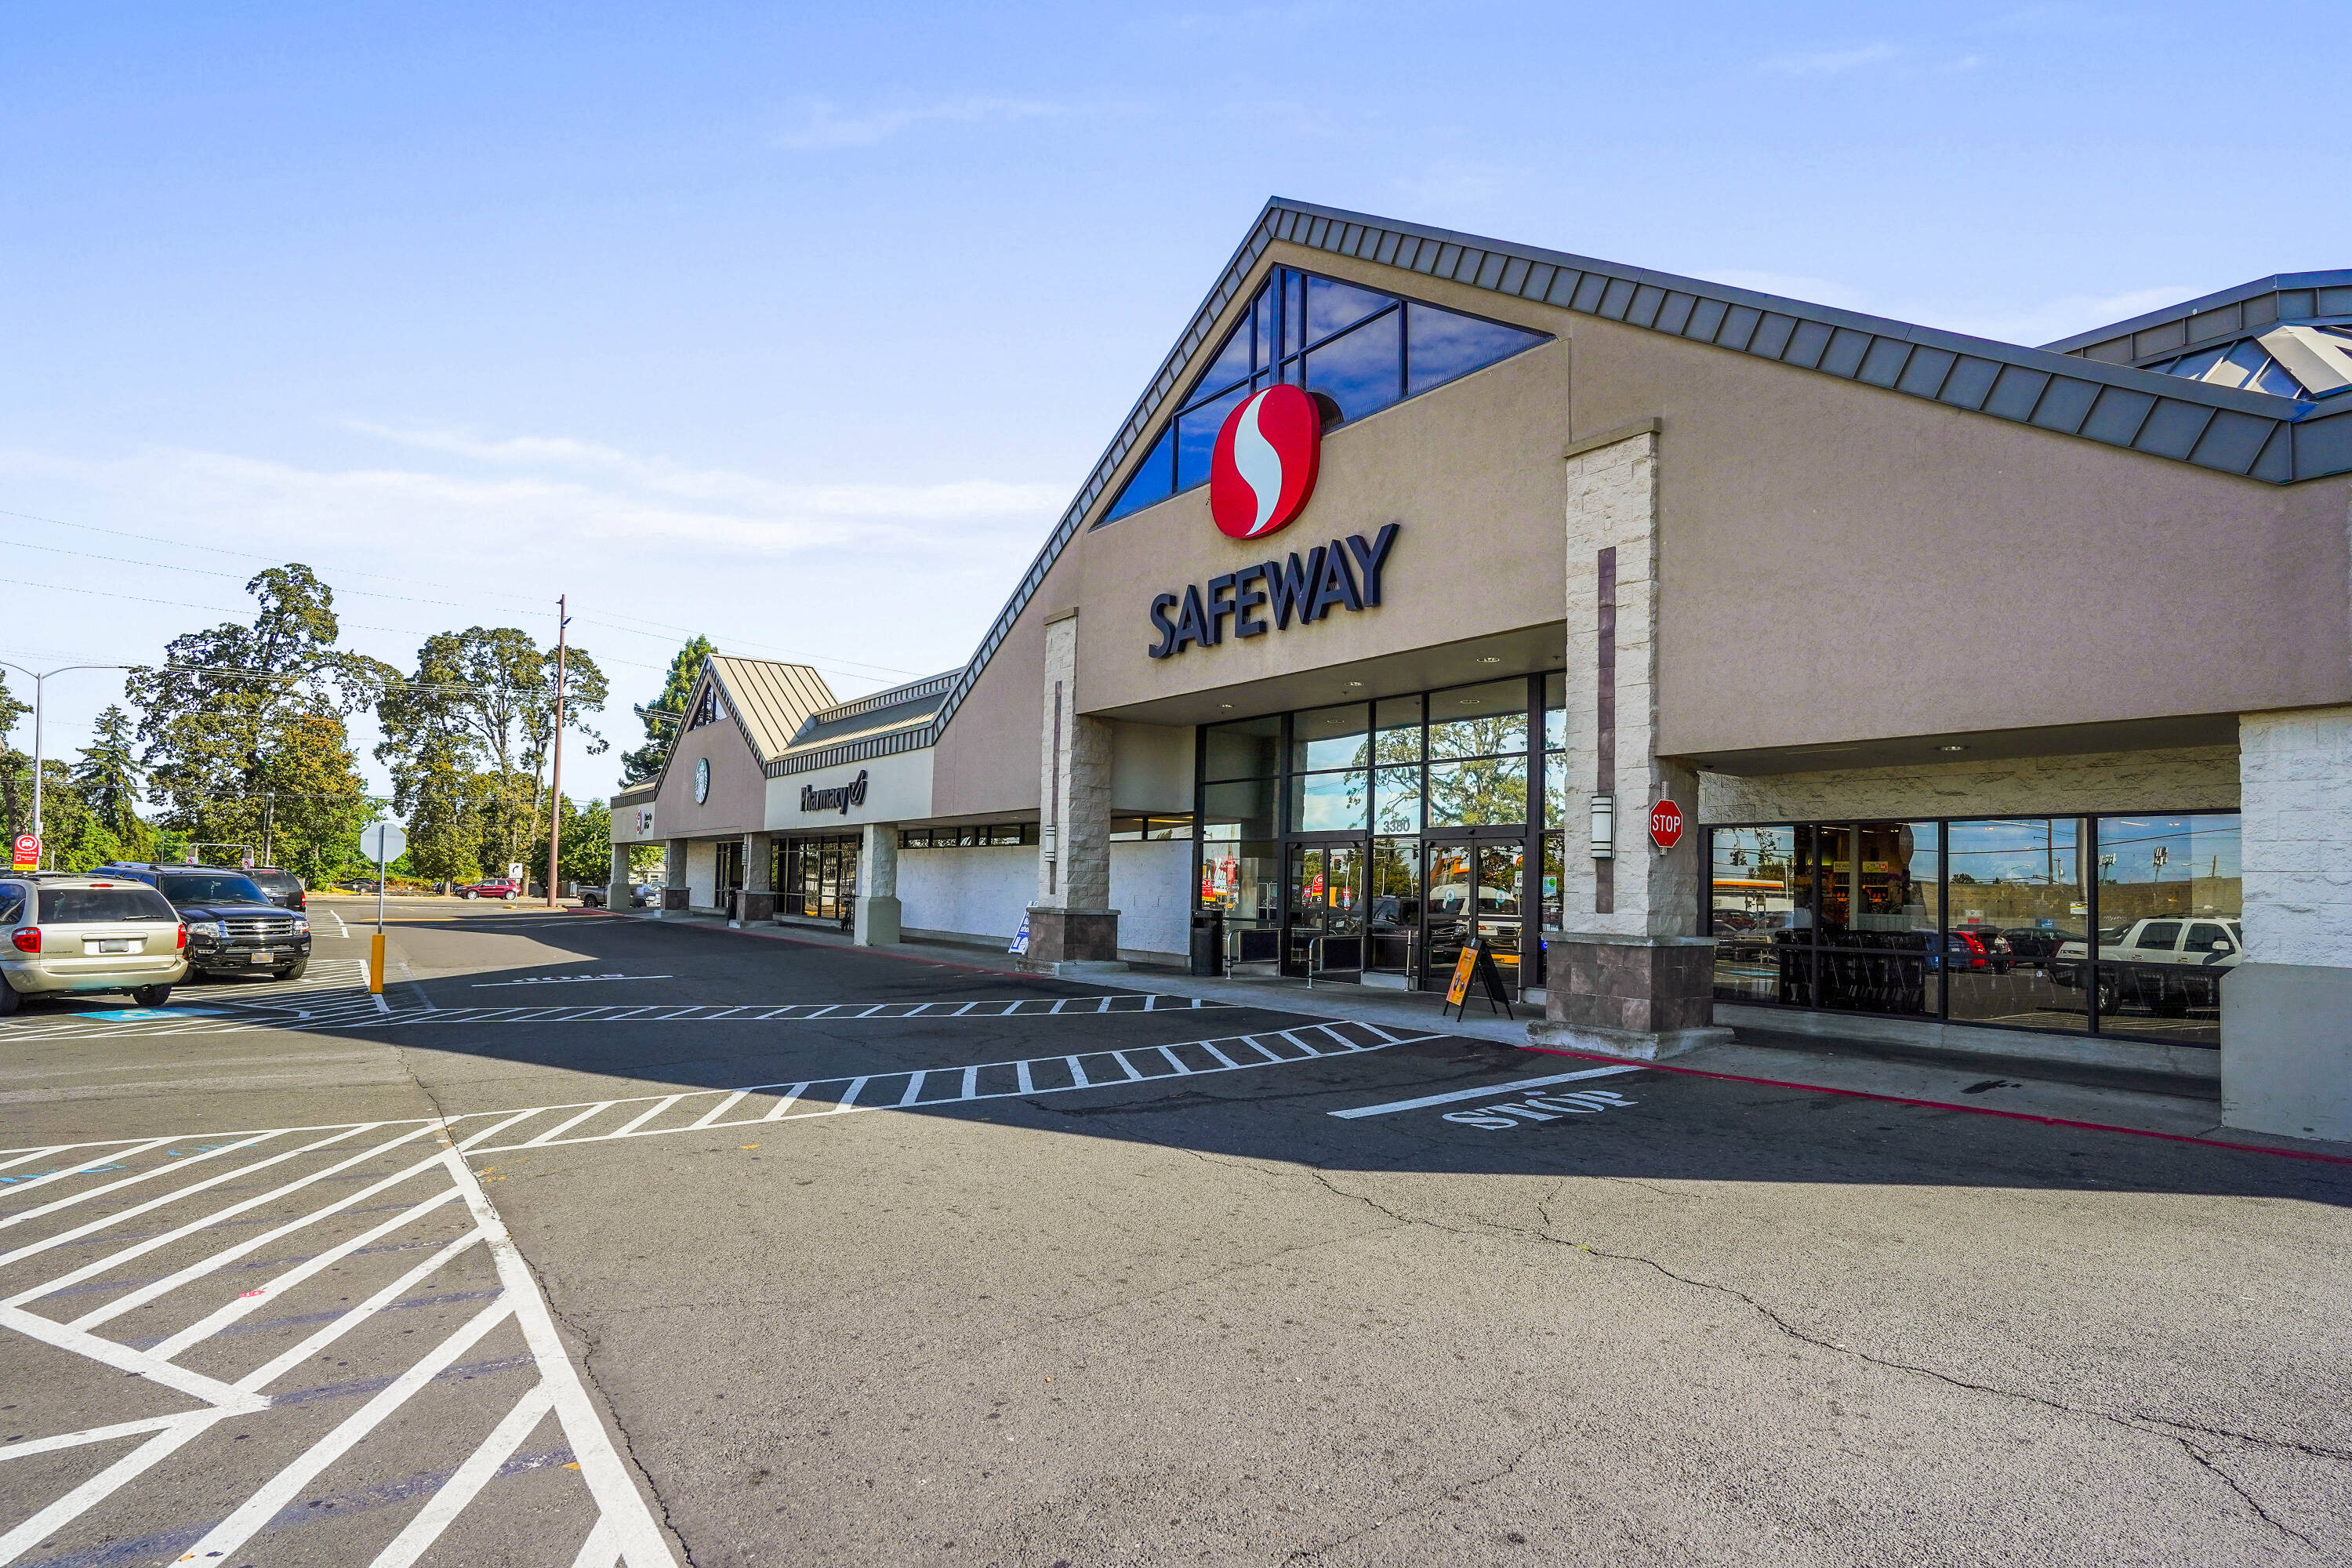
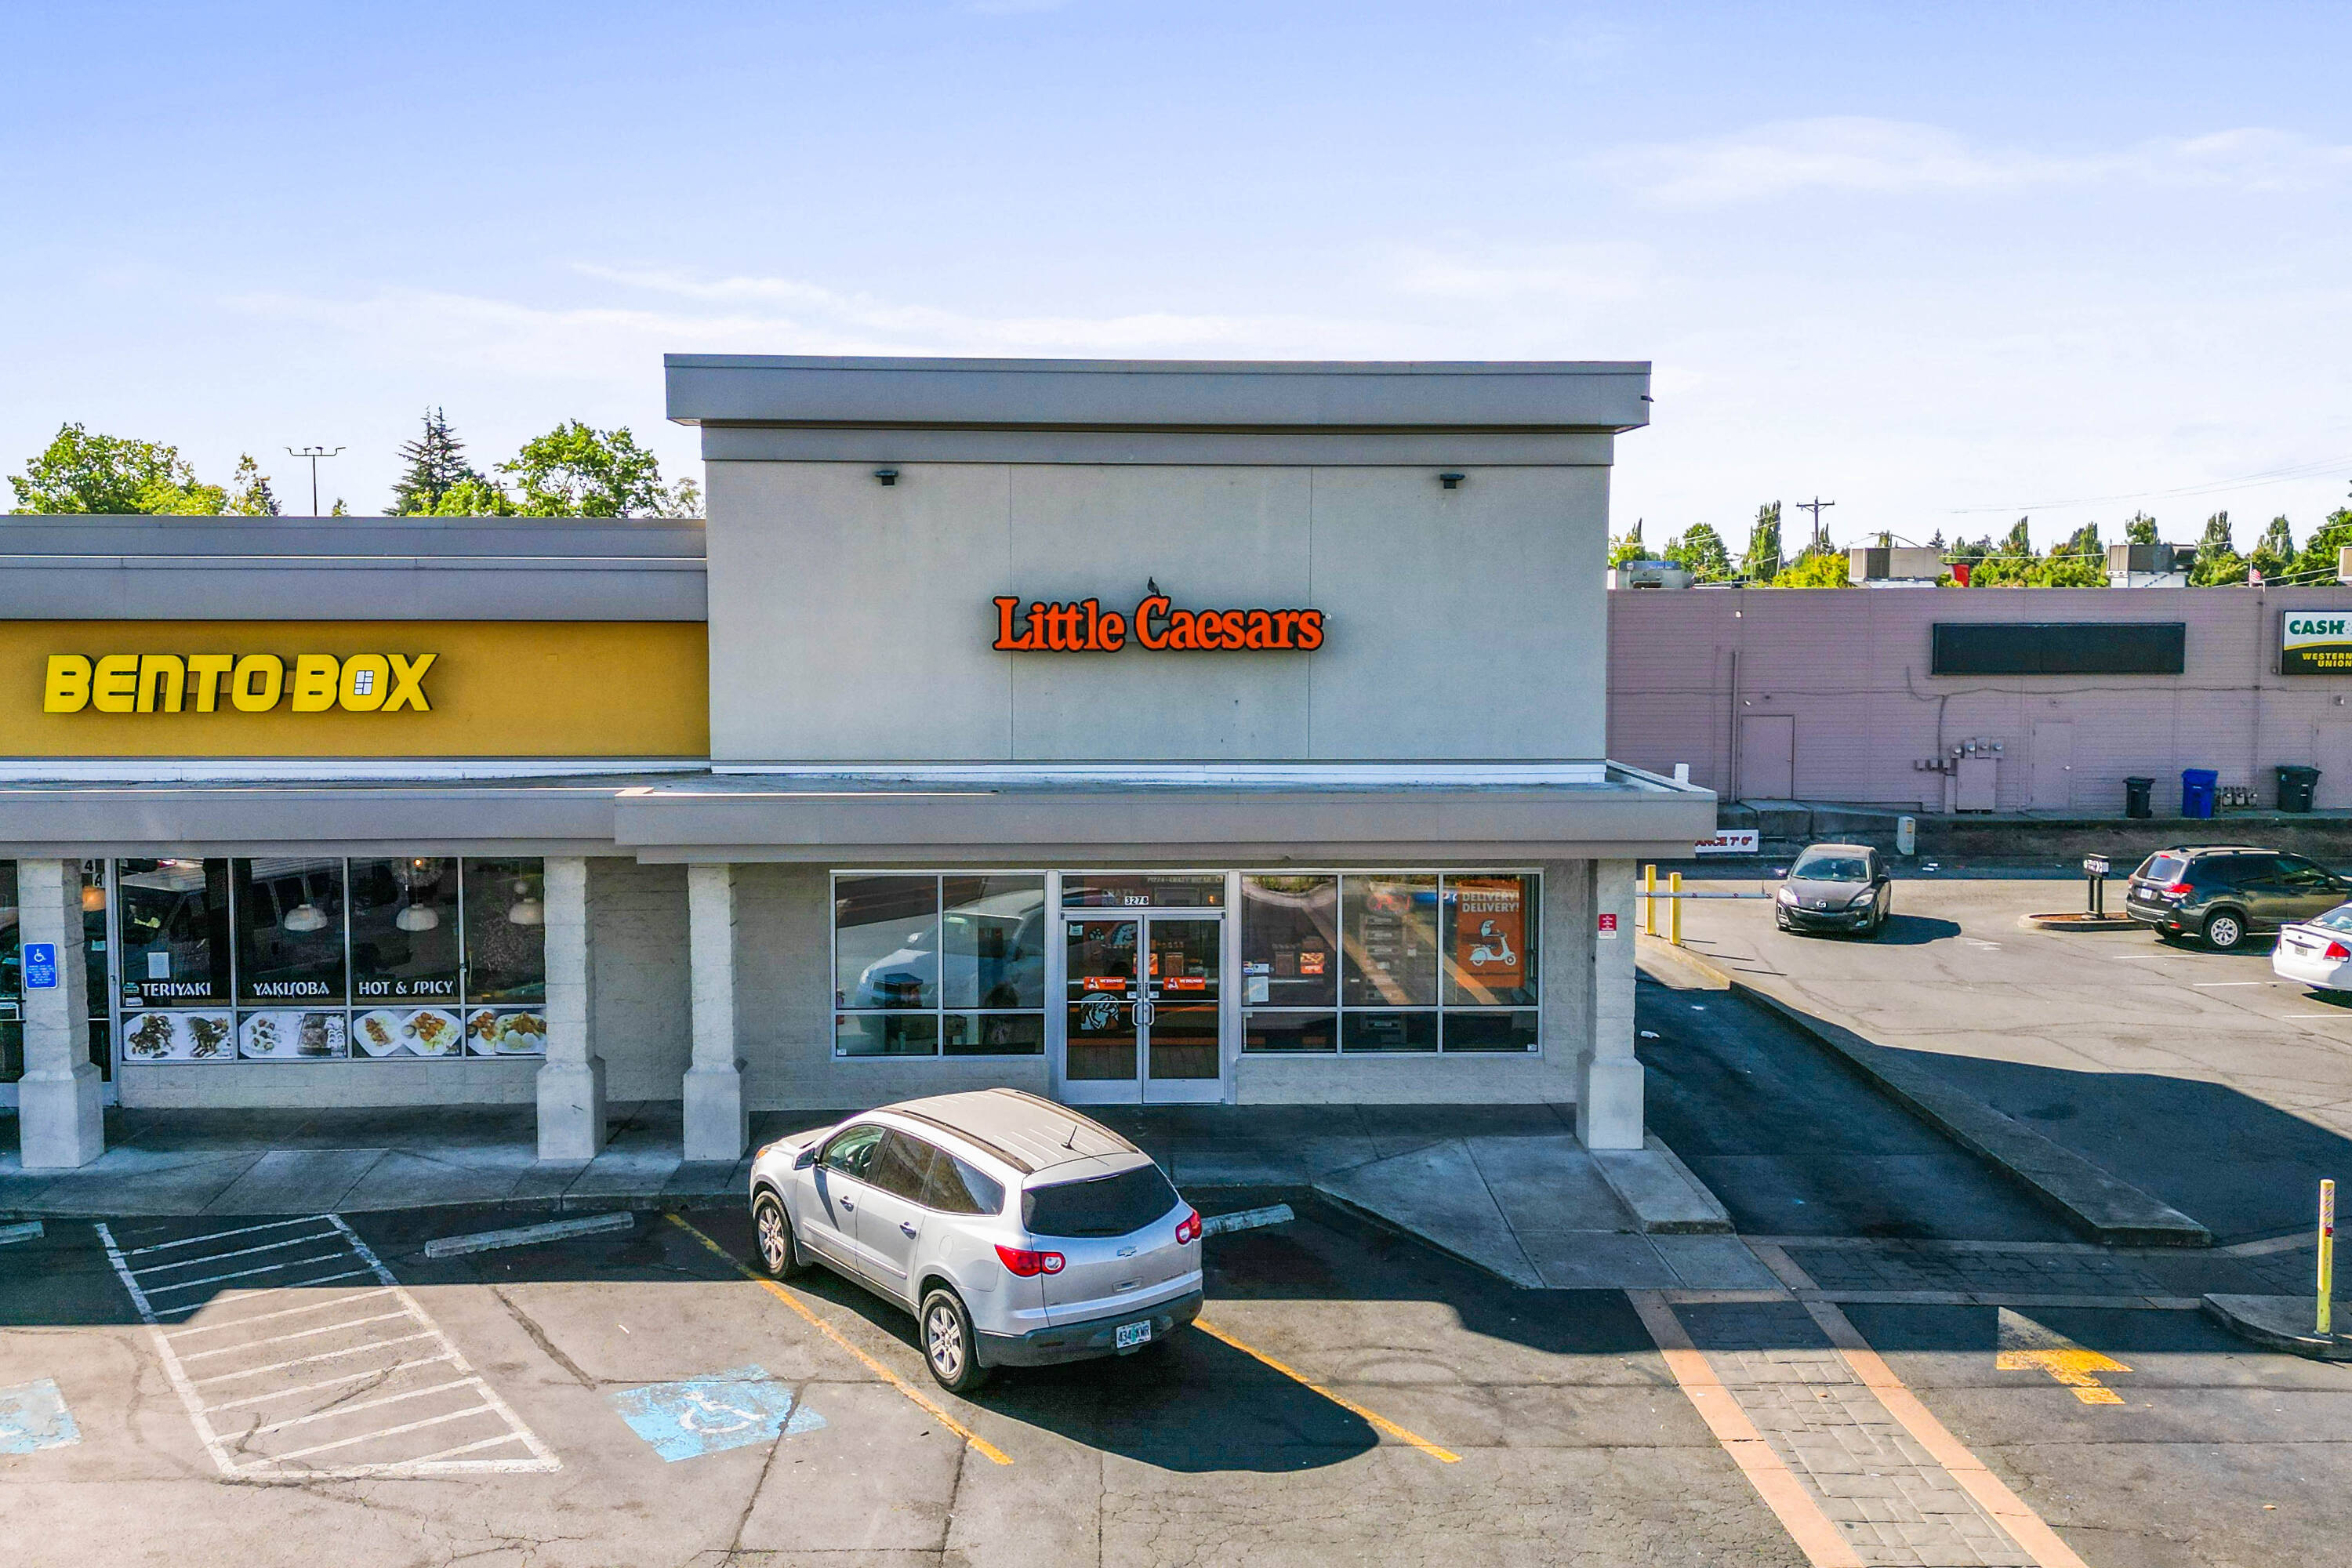
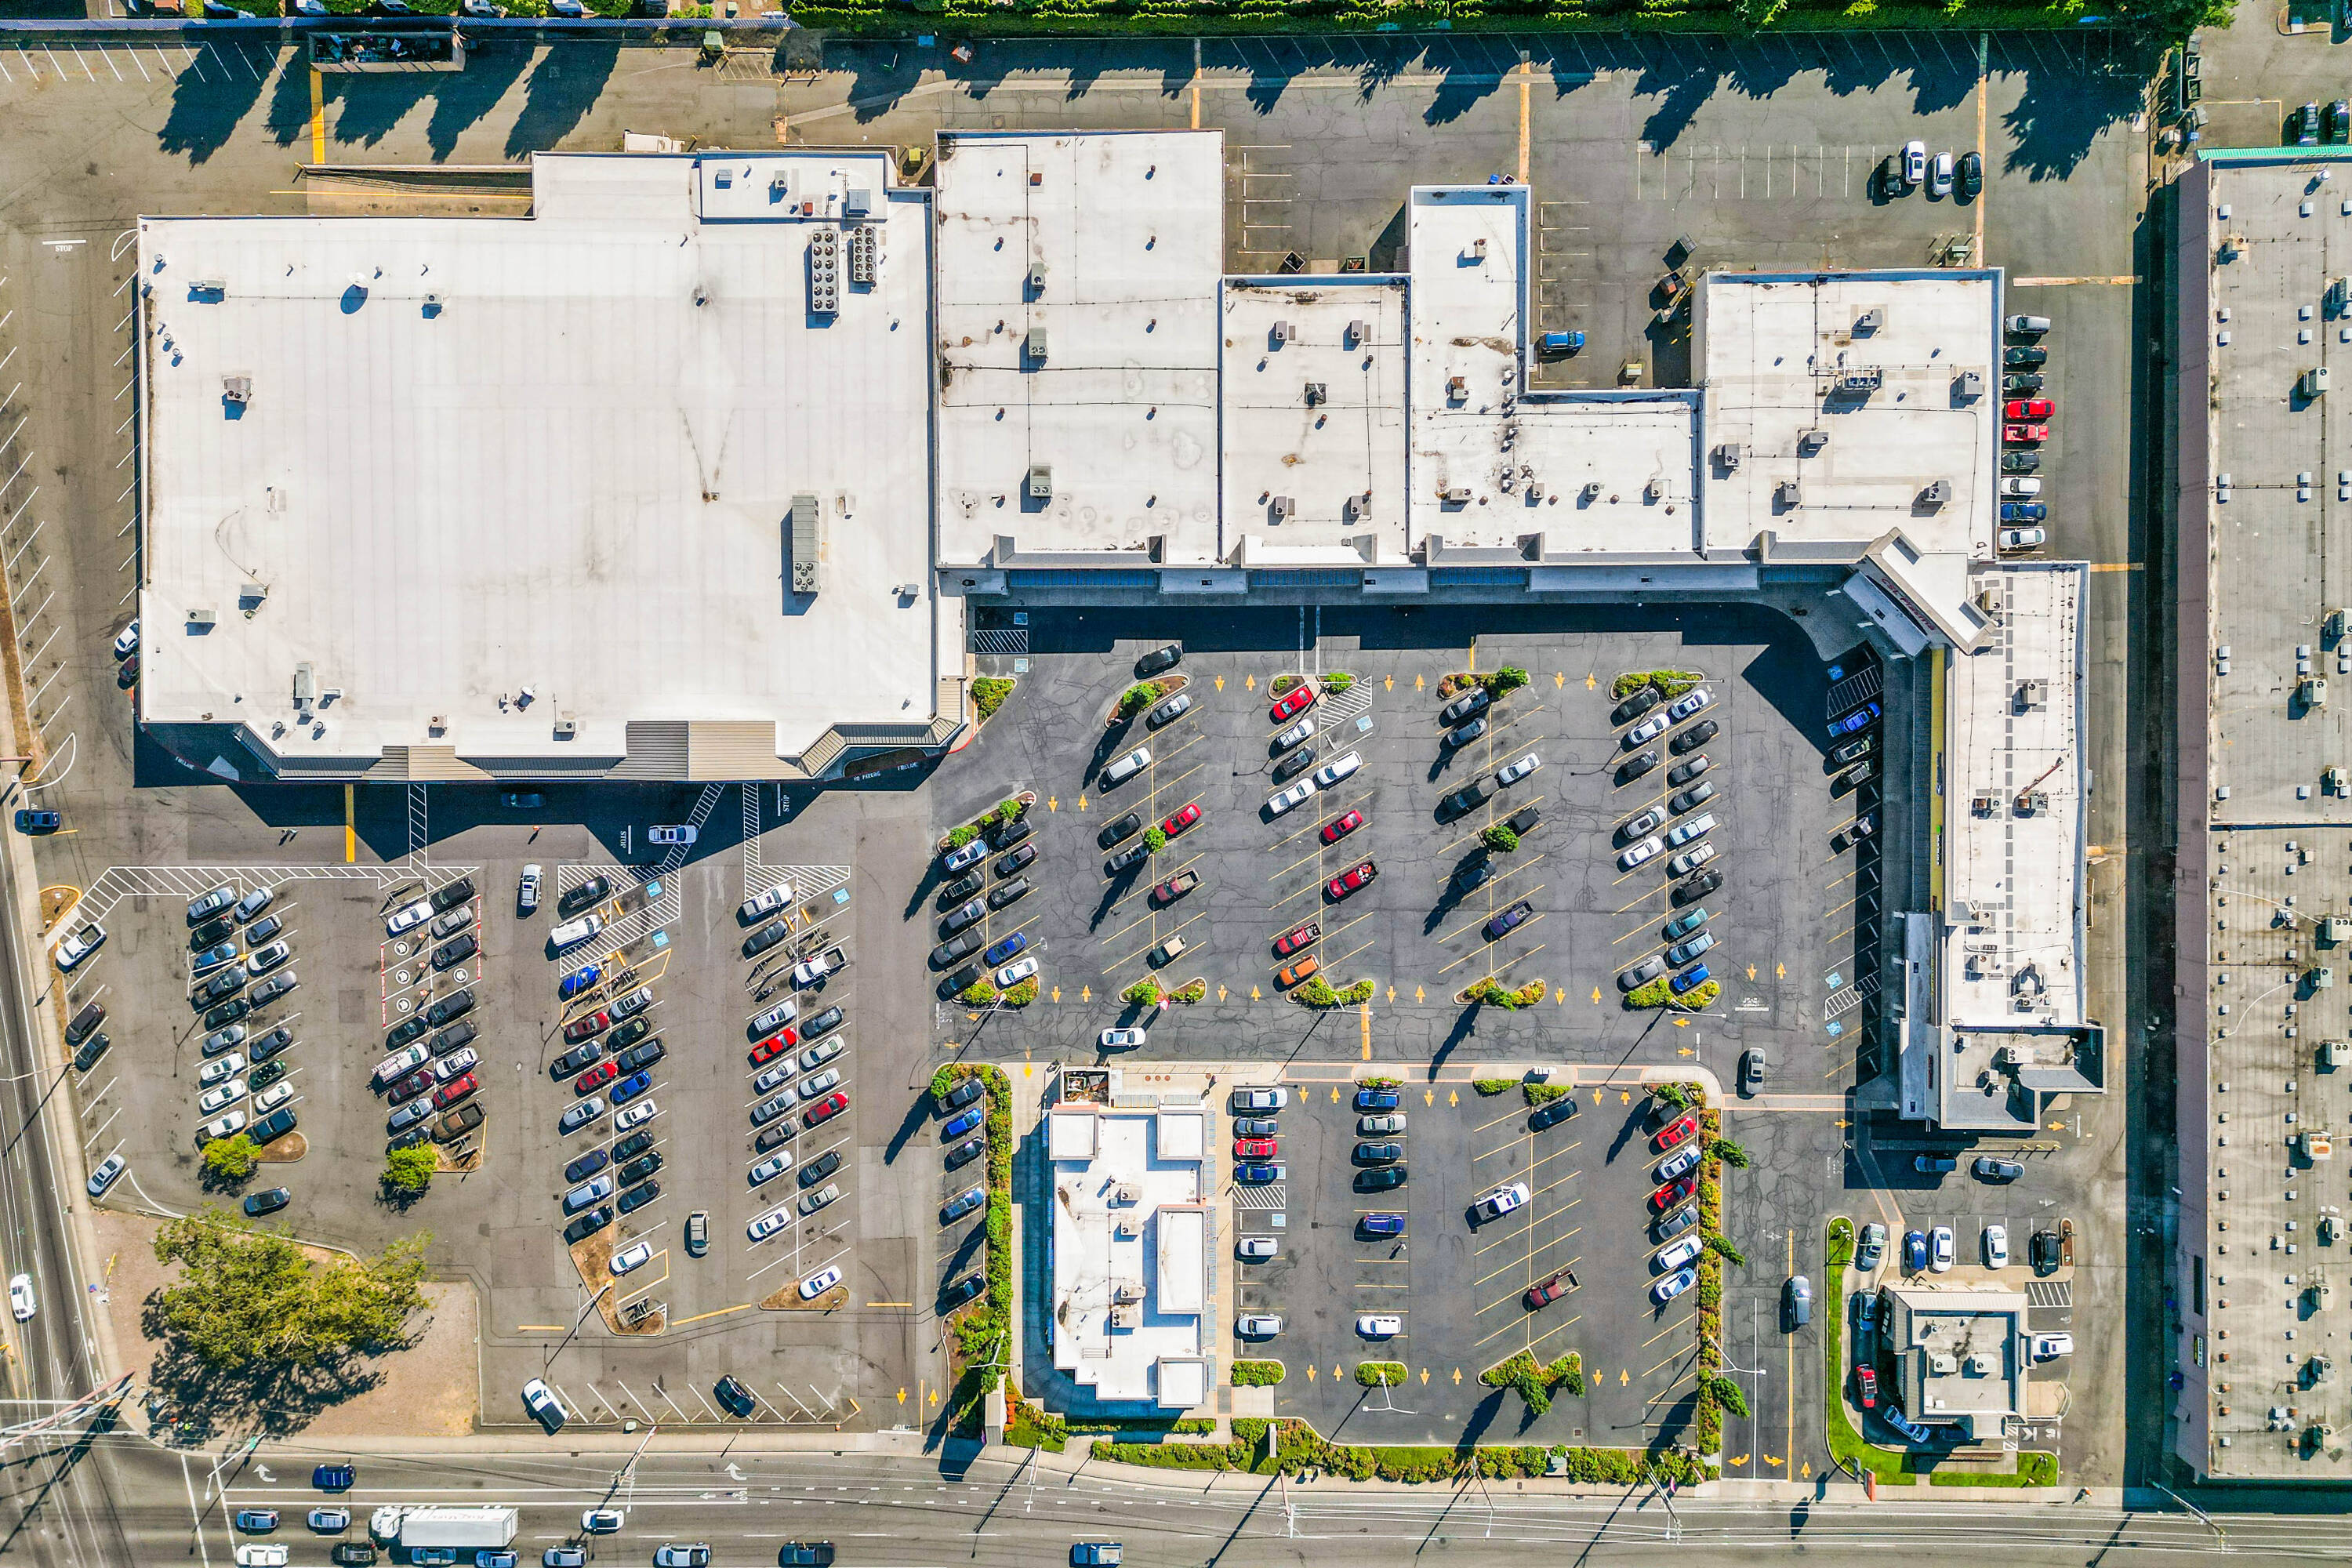
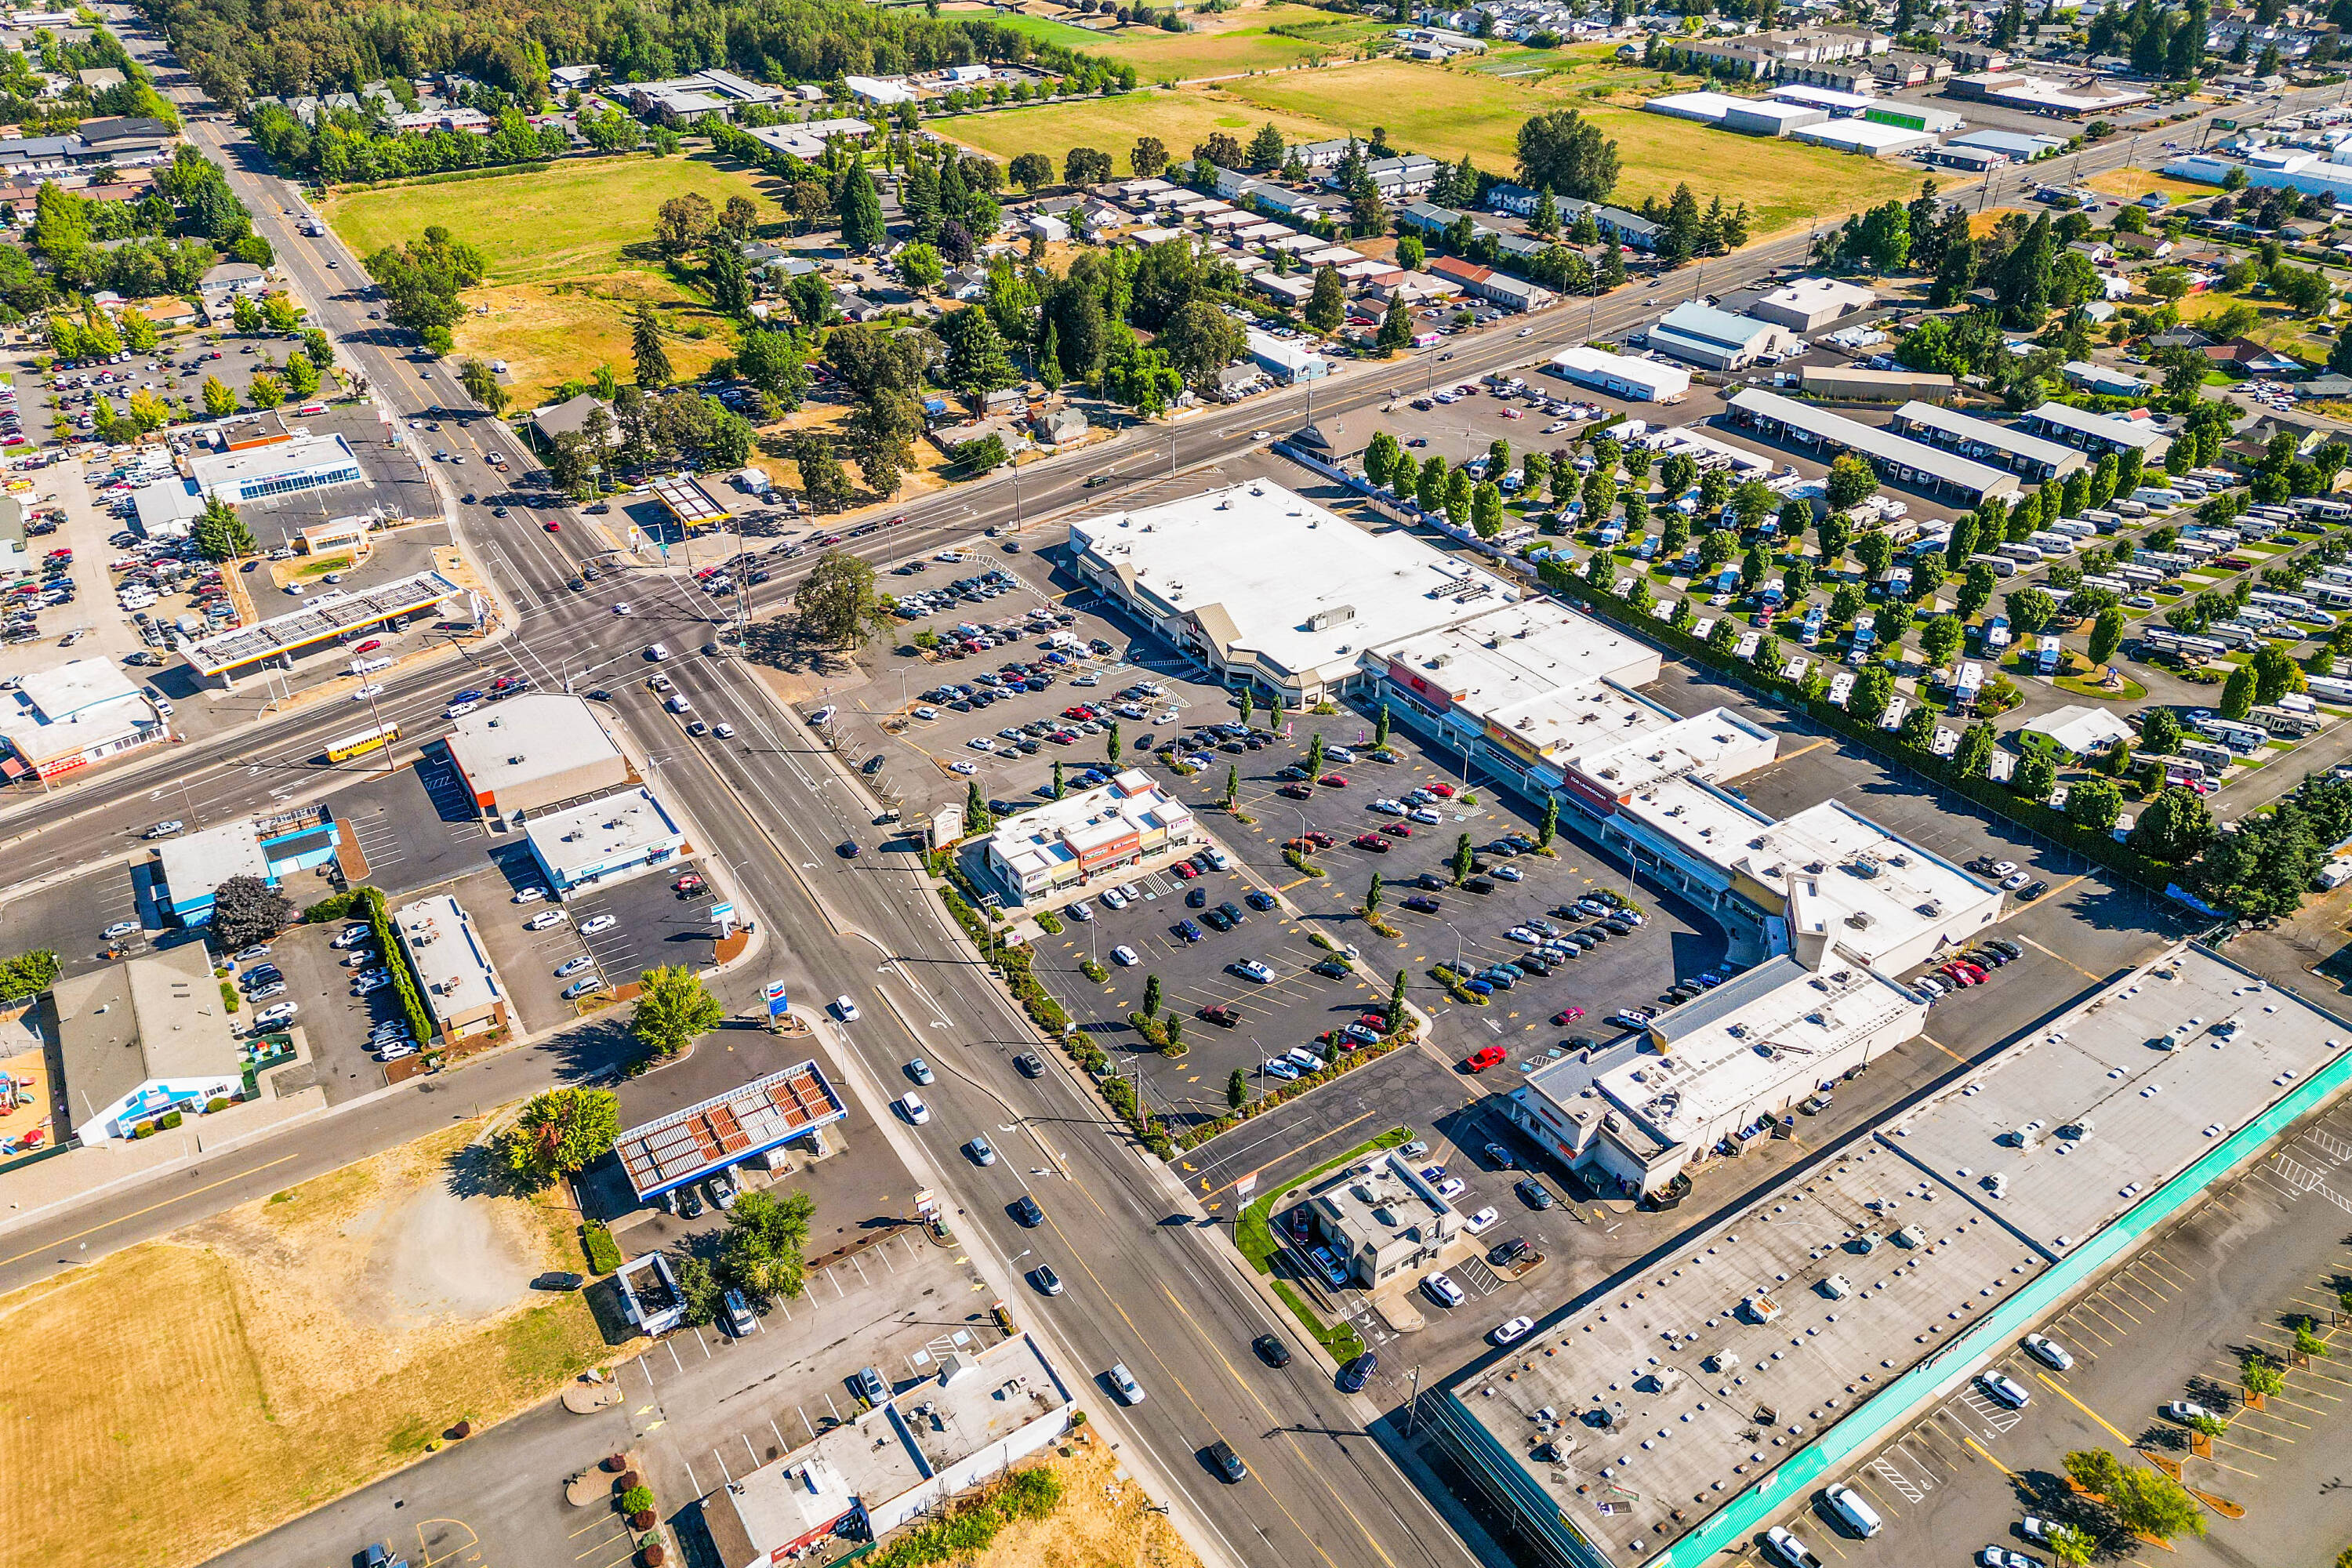
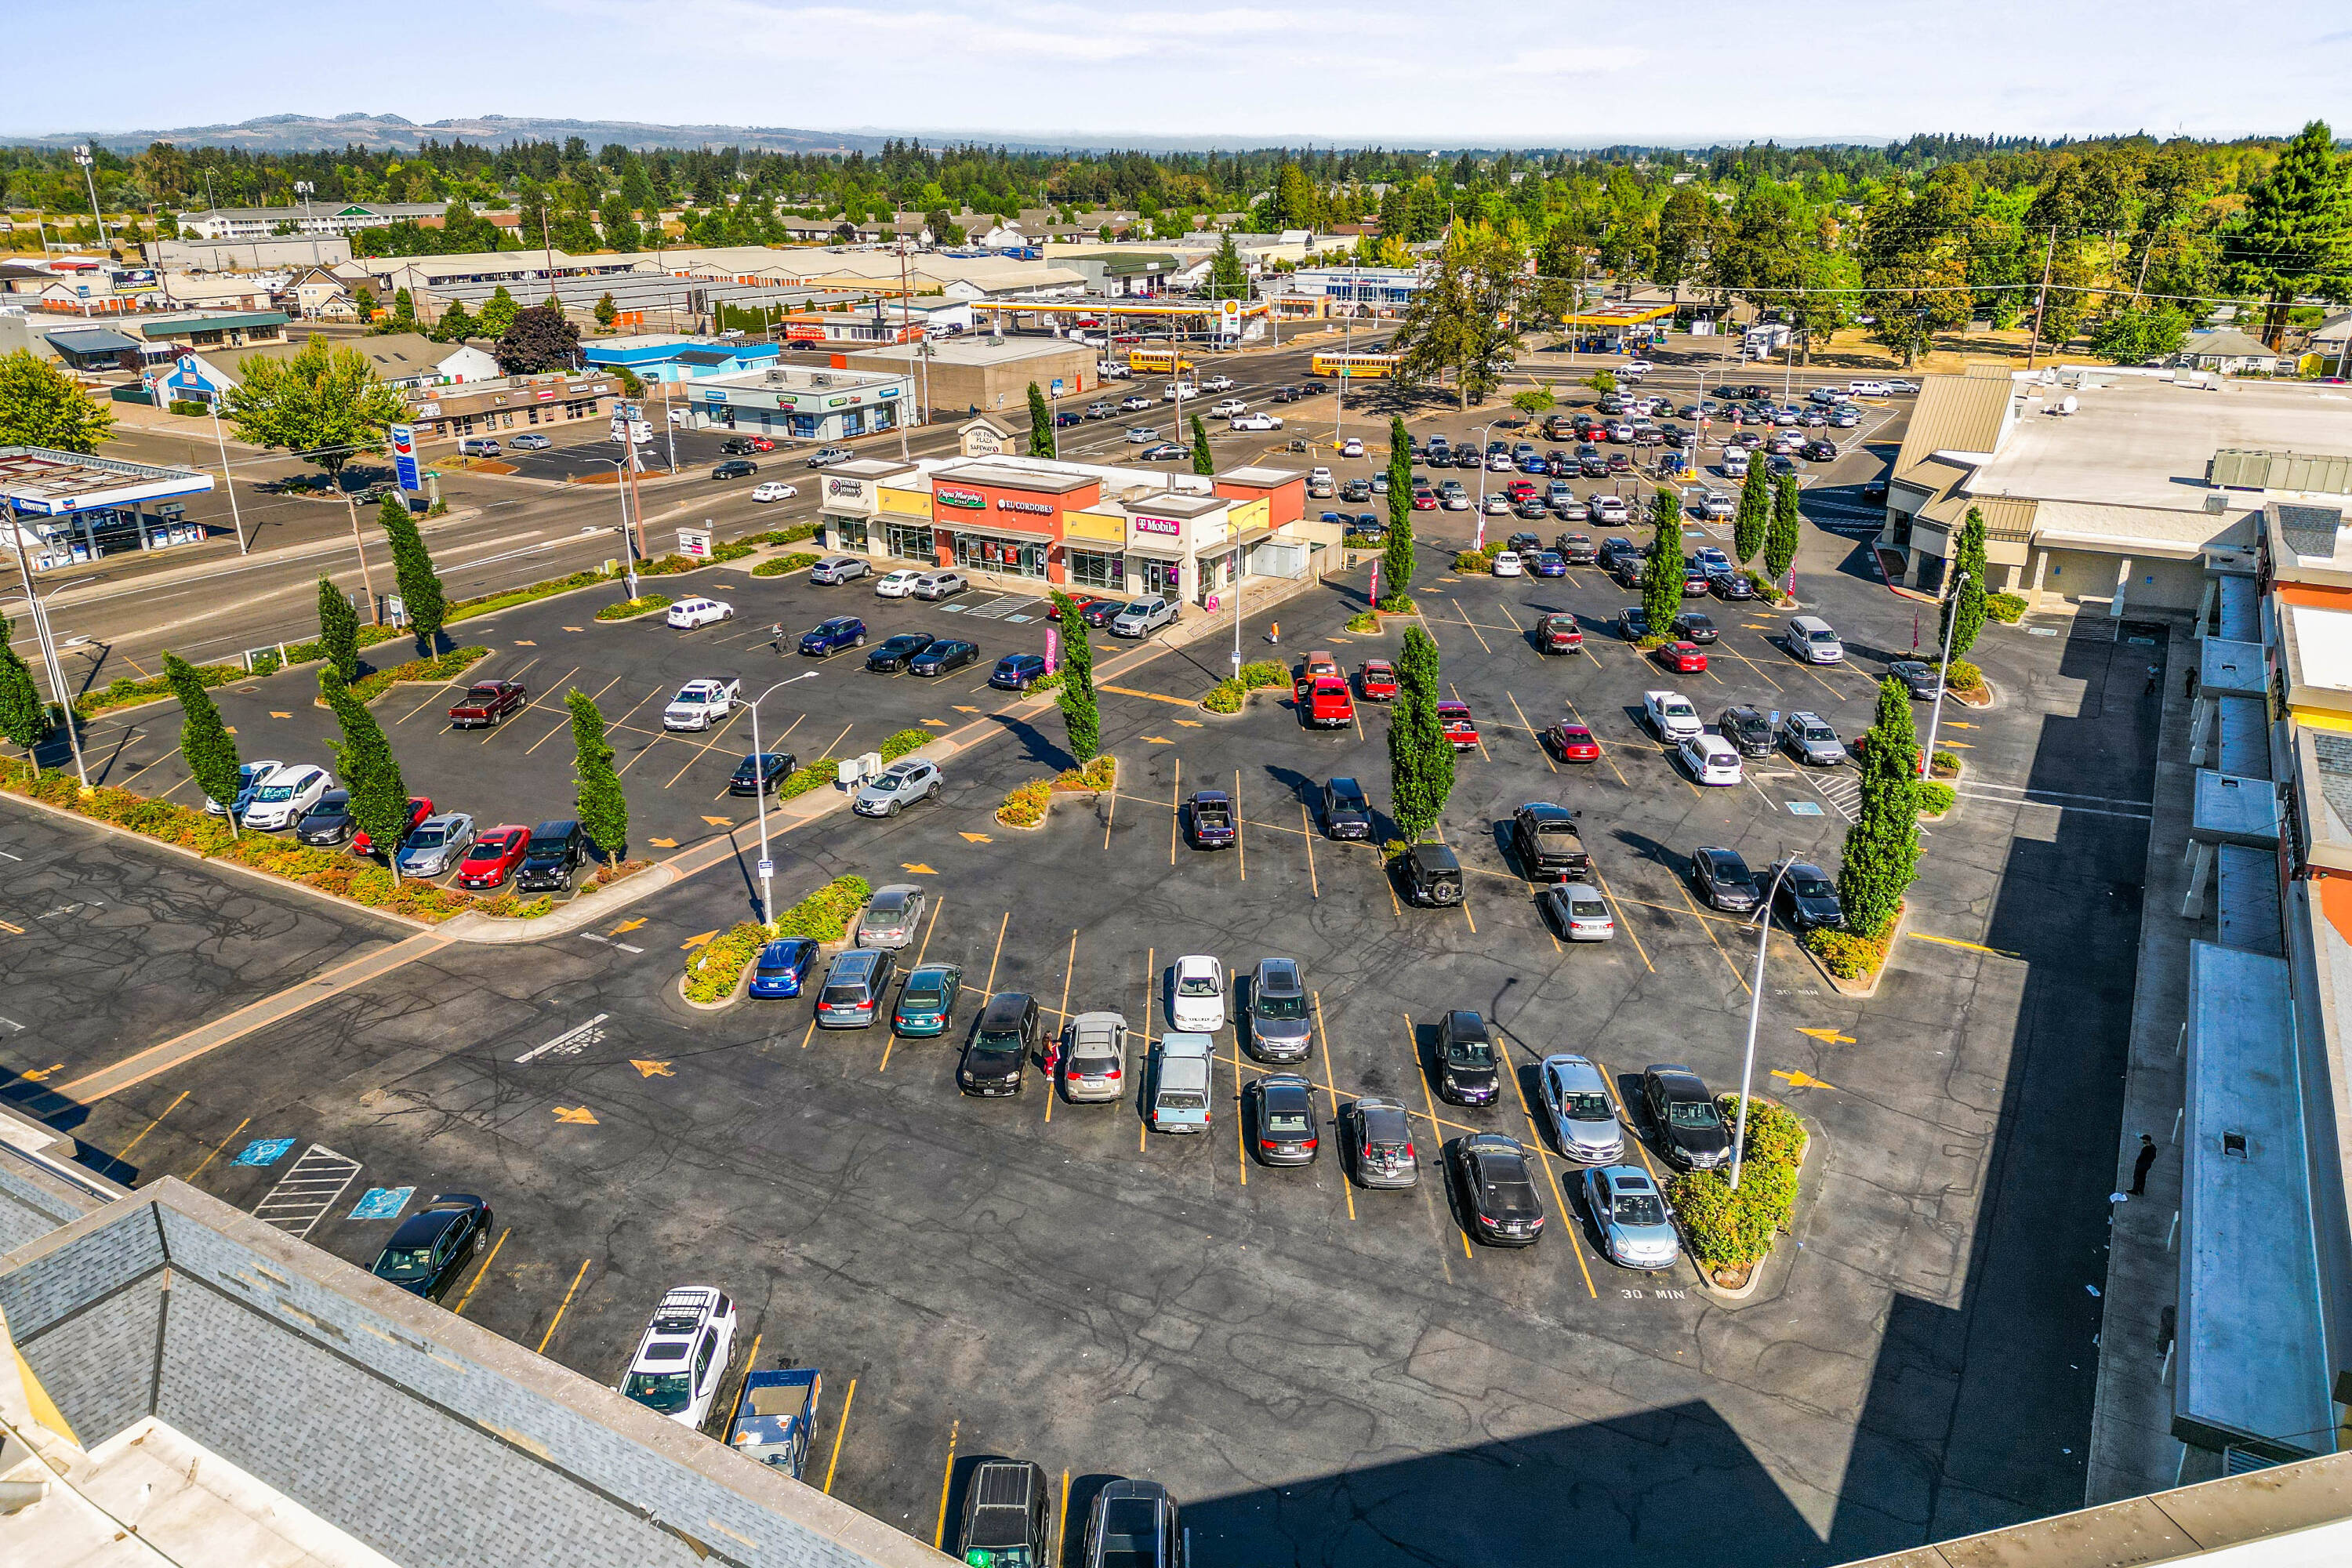
3380 Lancaster Dr NE, Salem, OR 97303
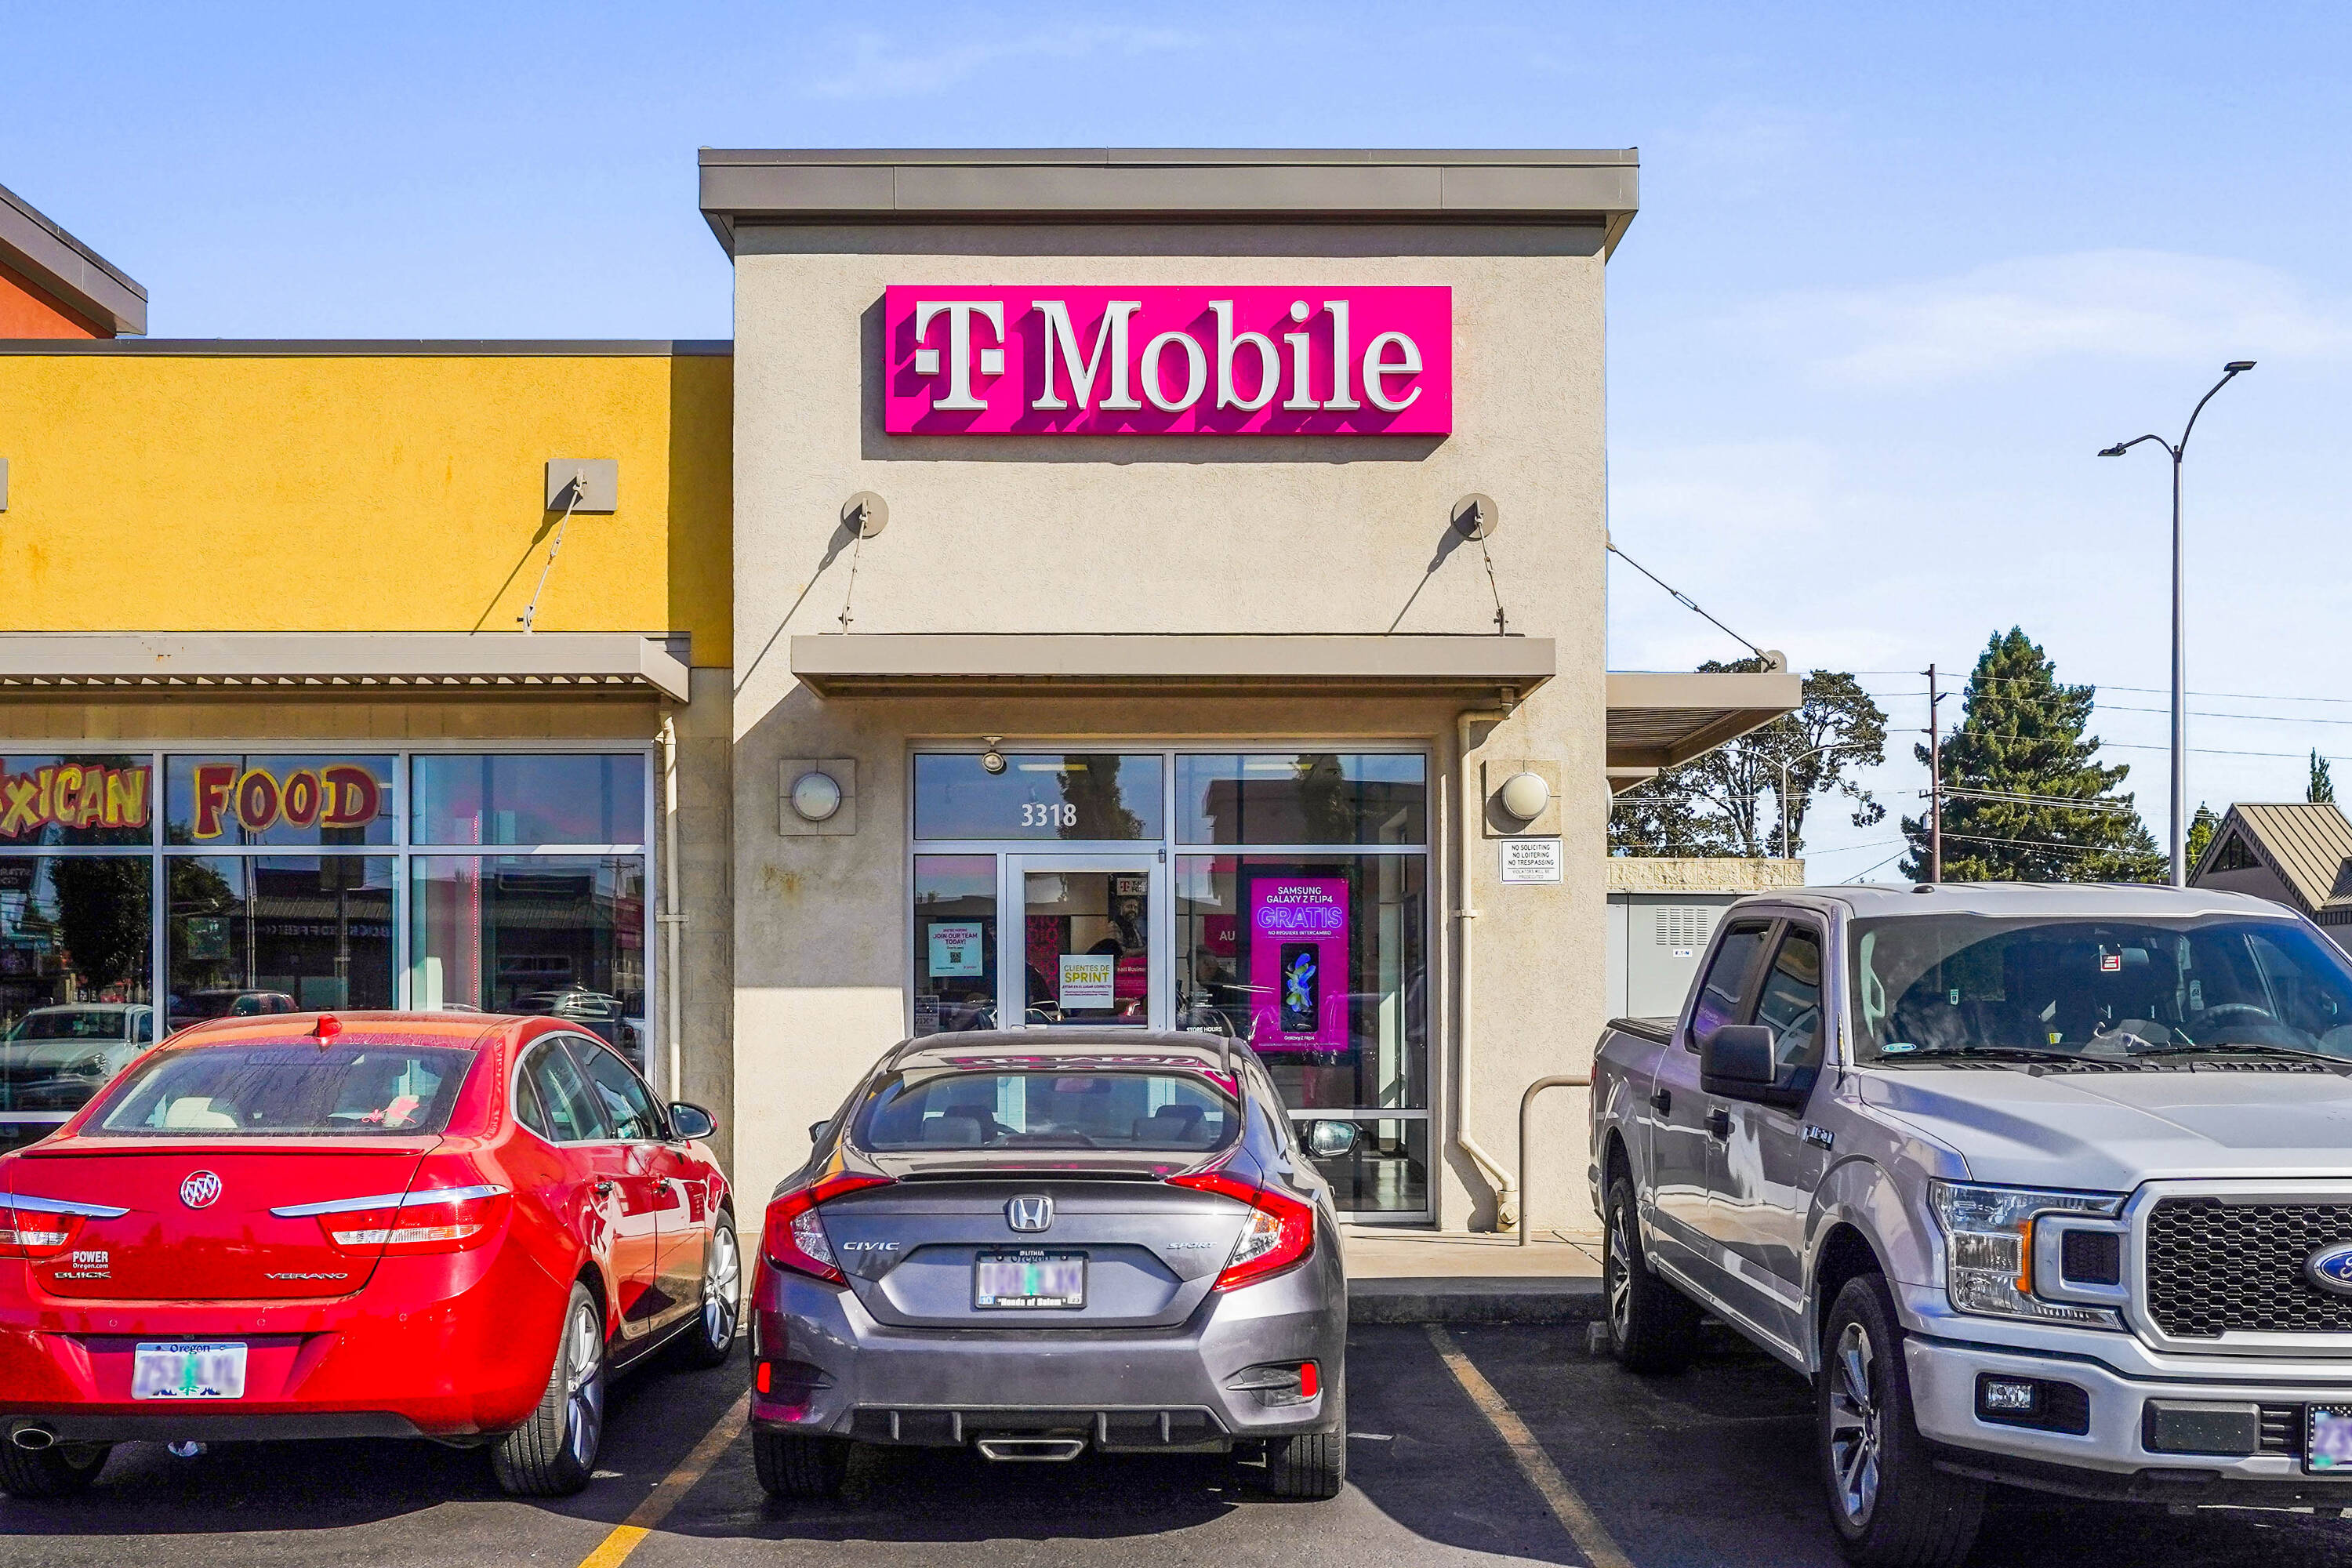
High-volume retail center with diverse tenant mix in Salem.
- Added:
- Mar 31, 2023
- Days on Market:
- 1194
- Last Refresh:
- Jul 5 at 8:14 am
Property Features for 3380 Lancaster Dr NE
General Information
- Standard status
- Active
- Property subtype
- Retail
Spaces For Lease
at 3380 Lancaster Dr NE Contact us
Listing office Coho Commercial (971) 707-4646
Listing date Mar 31, 2023
Source Crexi
Displayed information is deemed reliable but is not guaranteed and should be independently verified.
All listing content including descriptions, pricing, images are the copyrighted material of Coho Commercial
HighLights
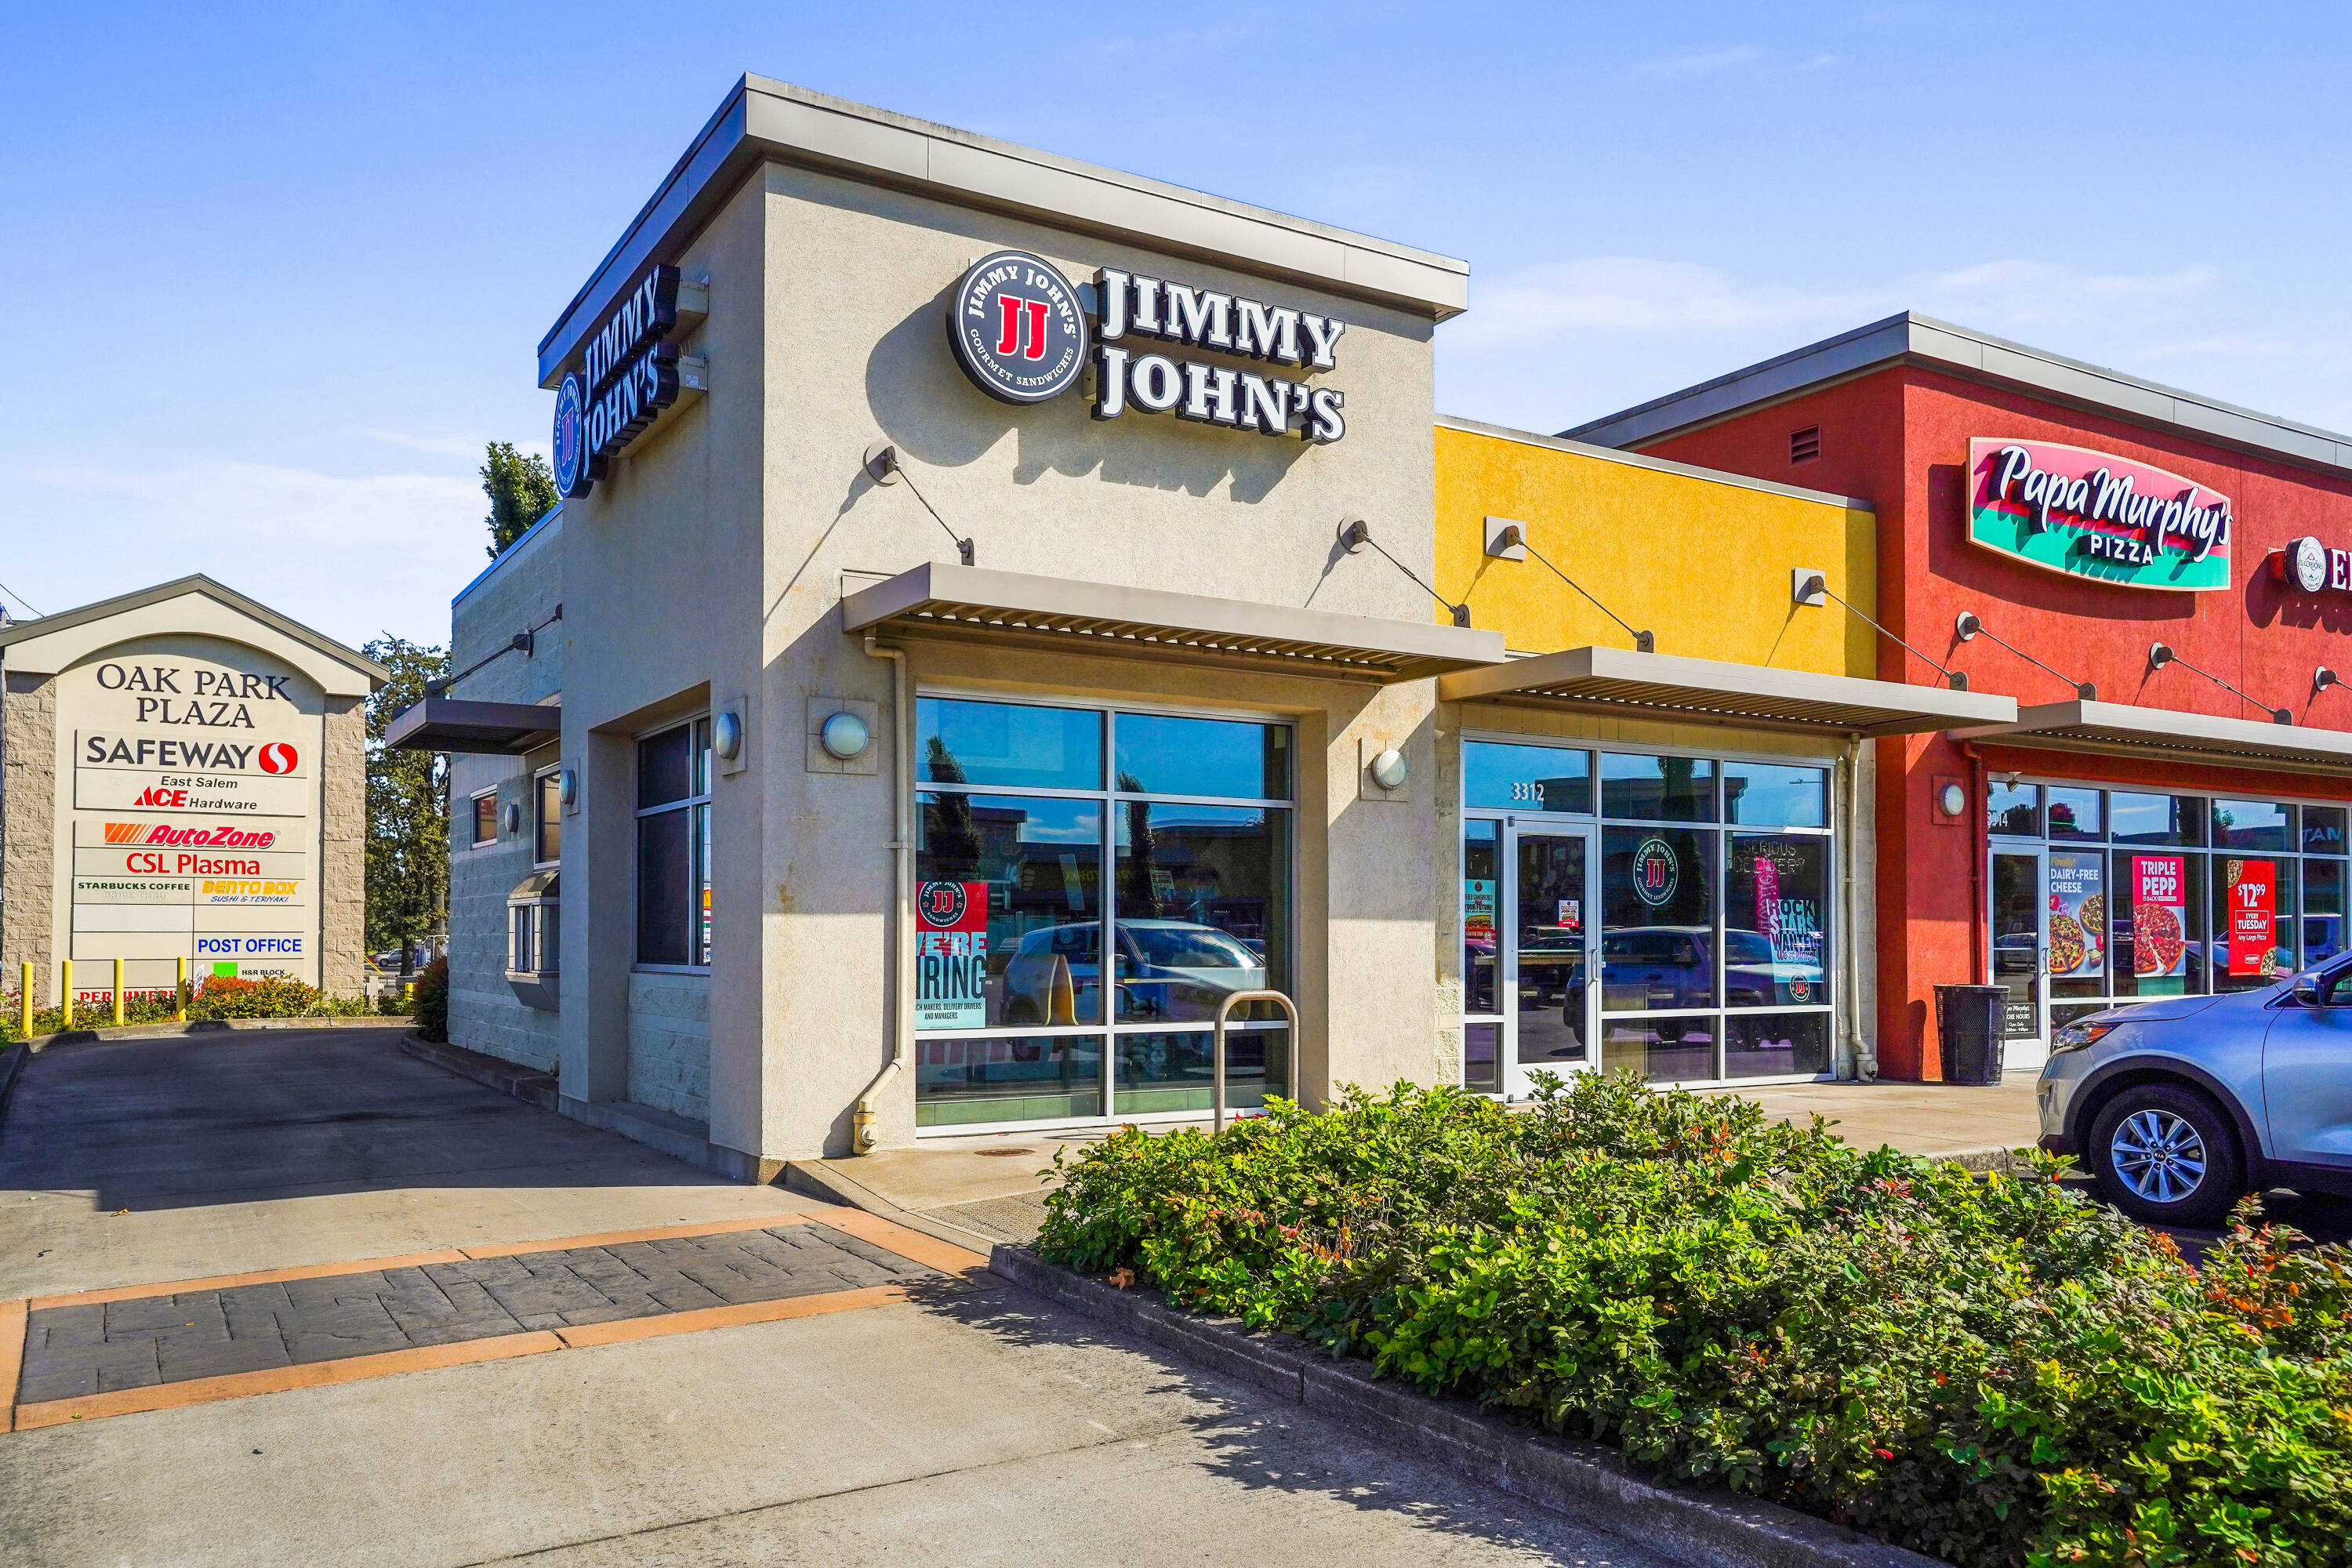
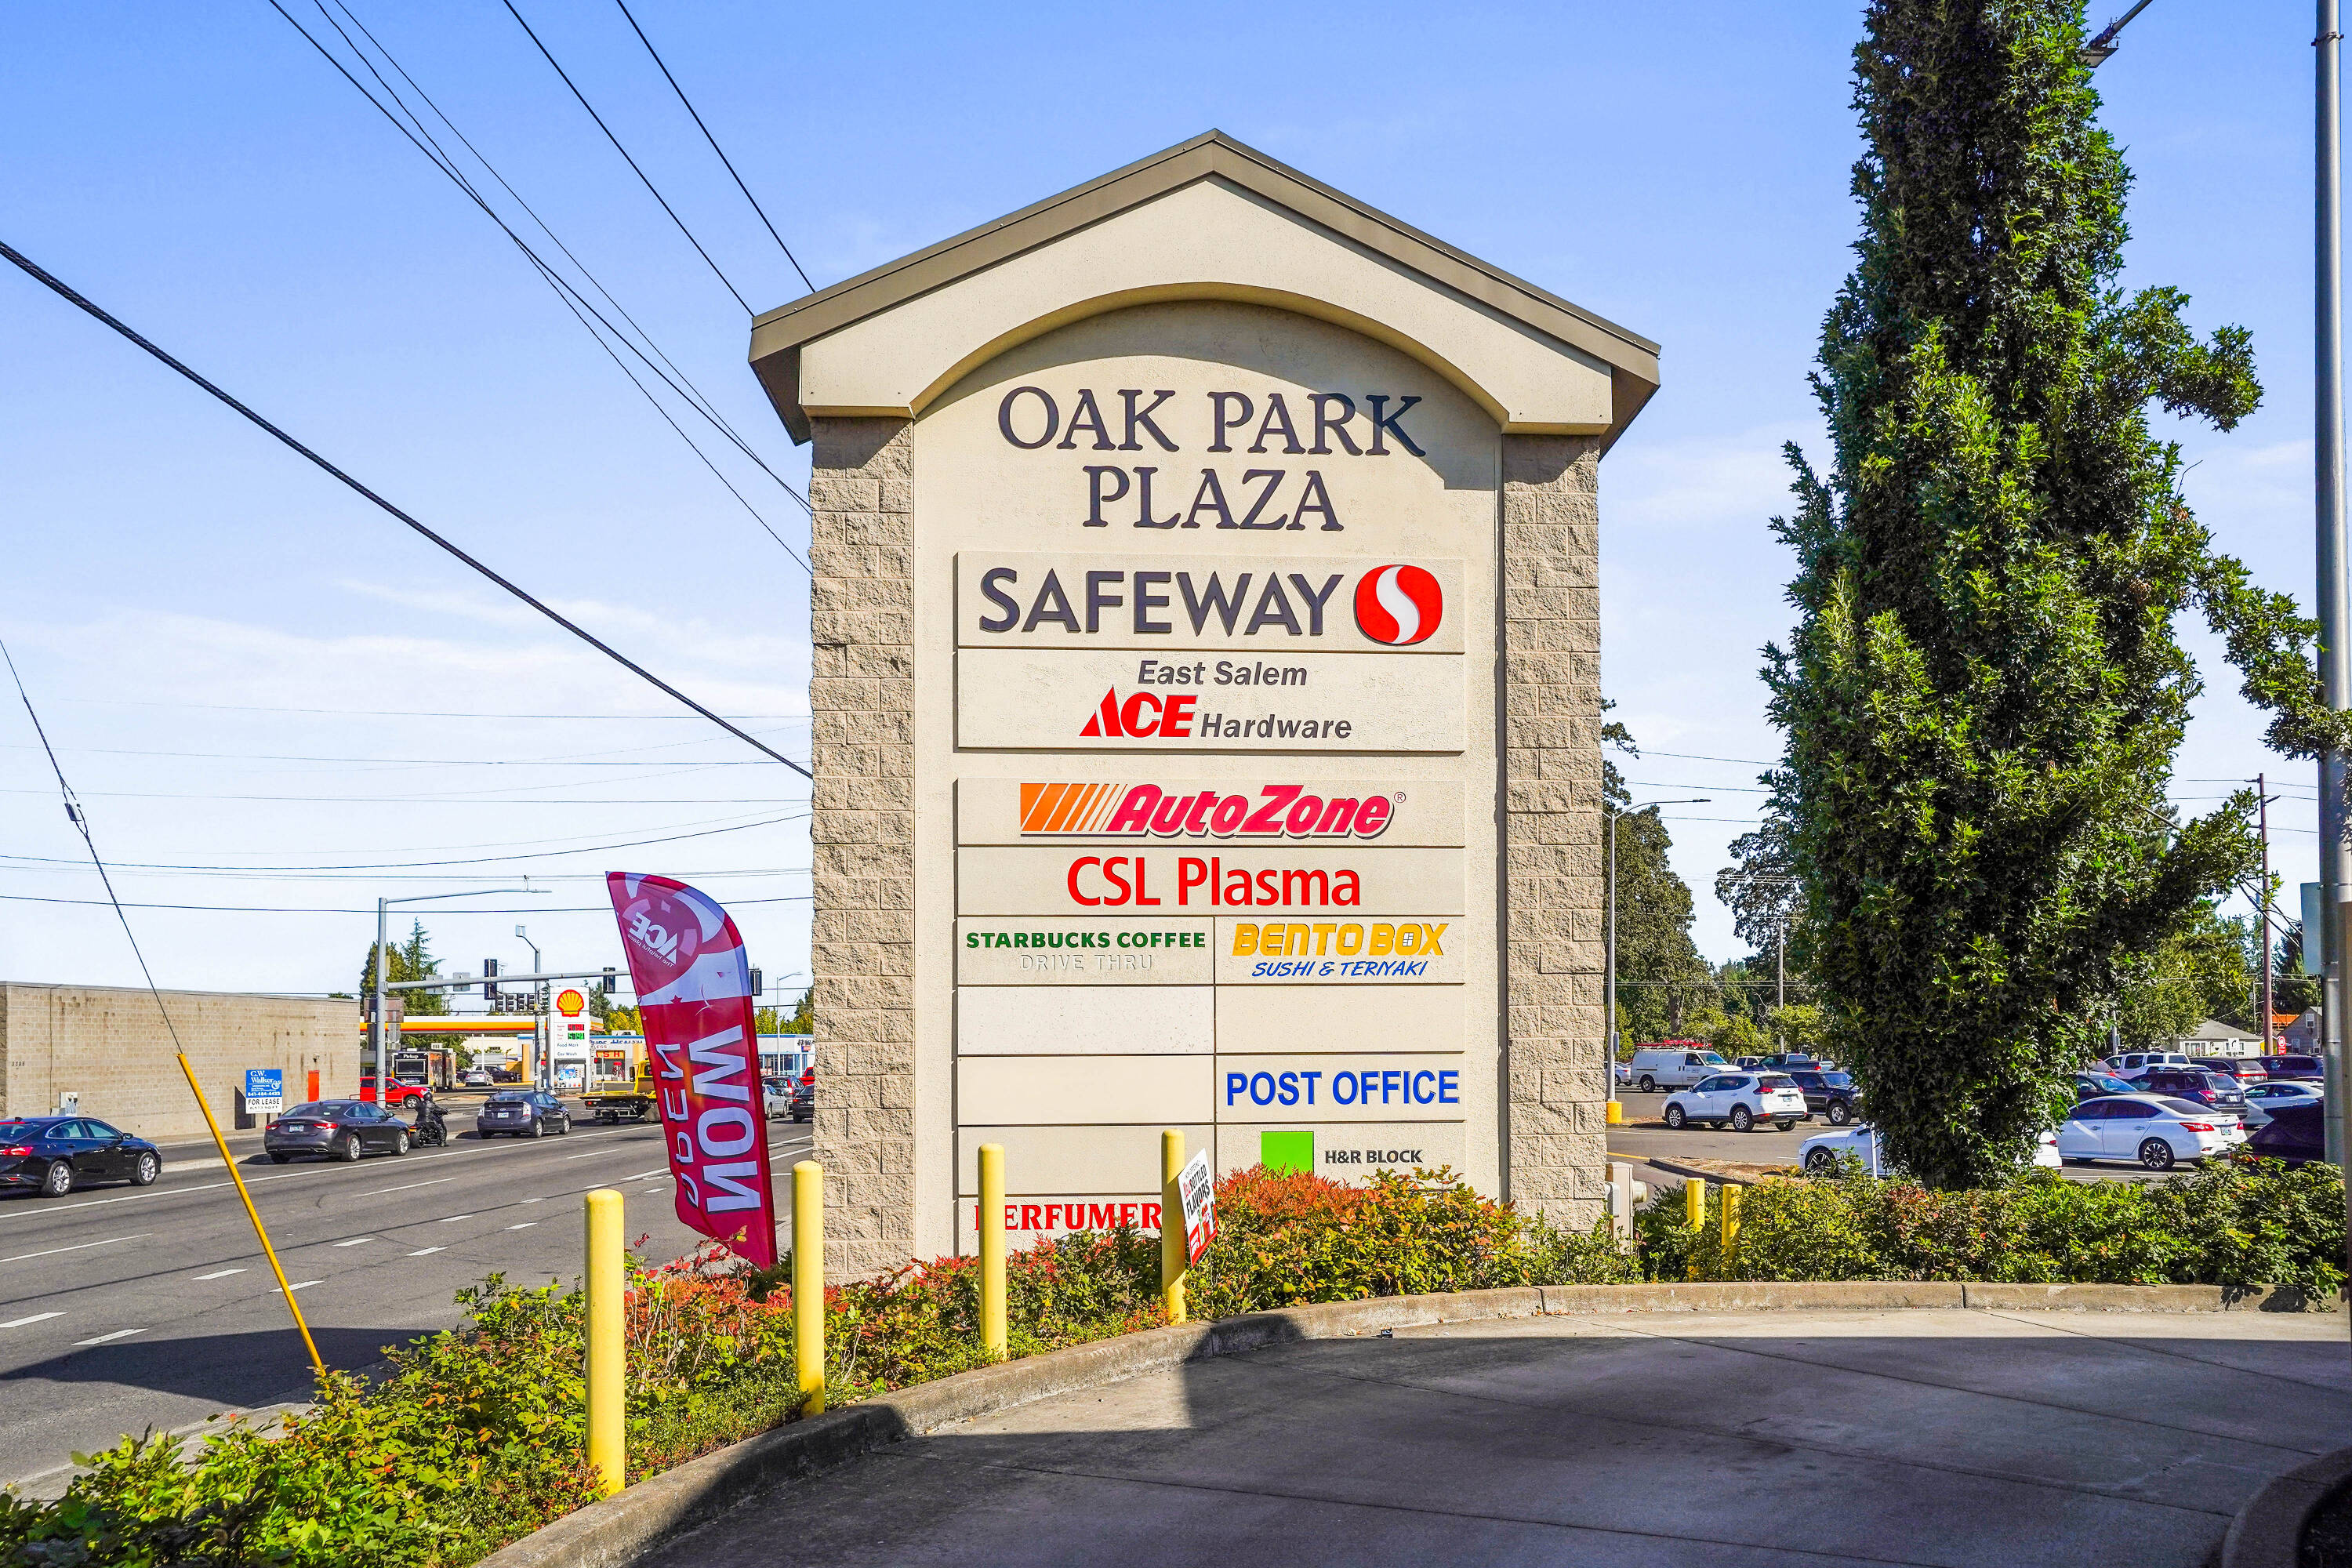
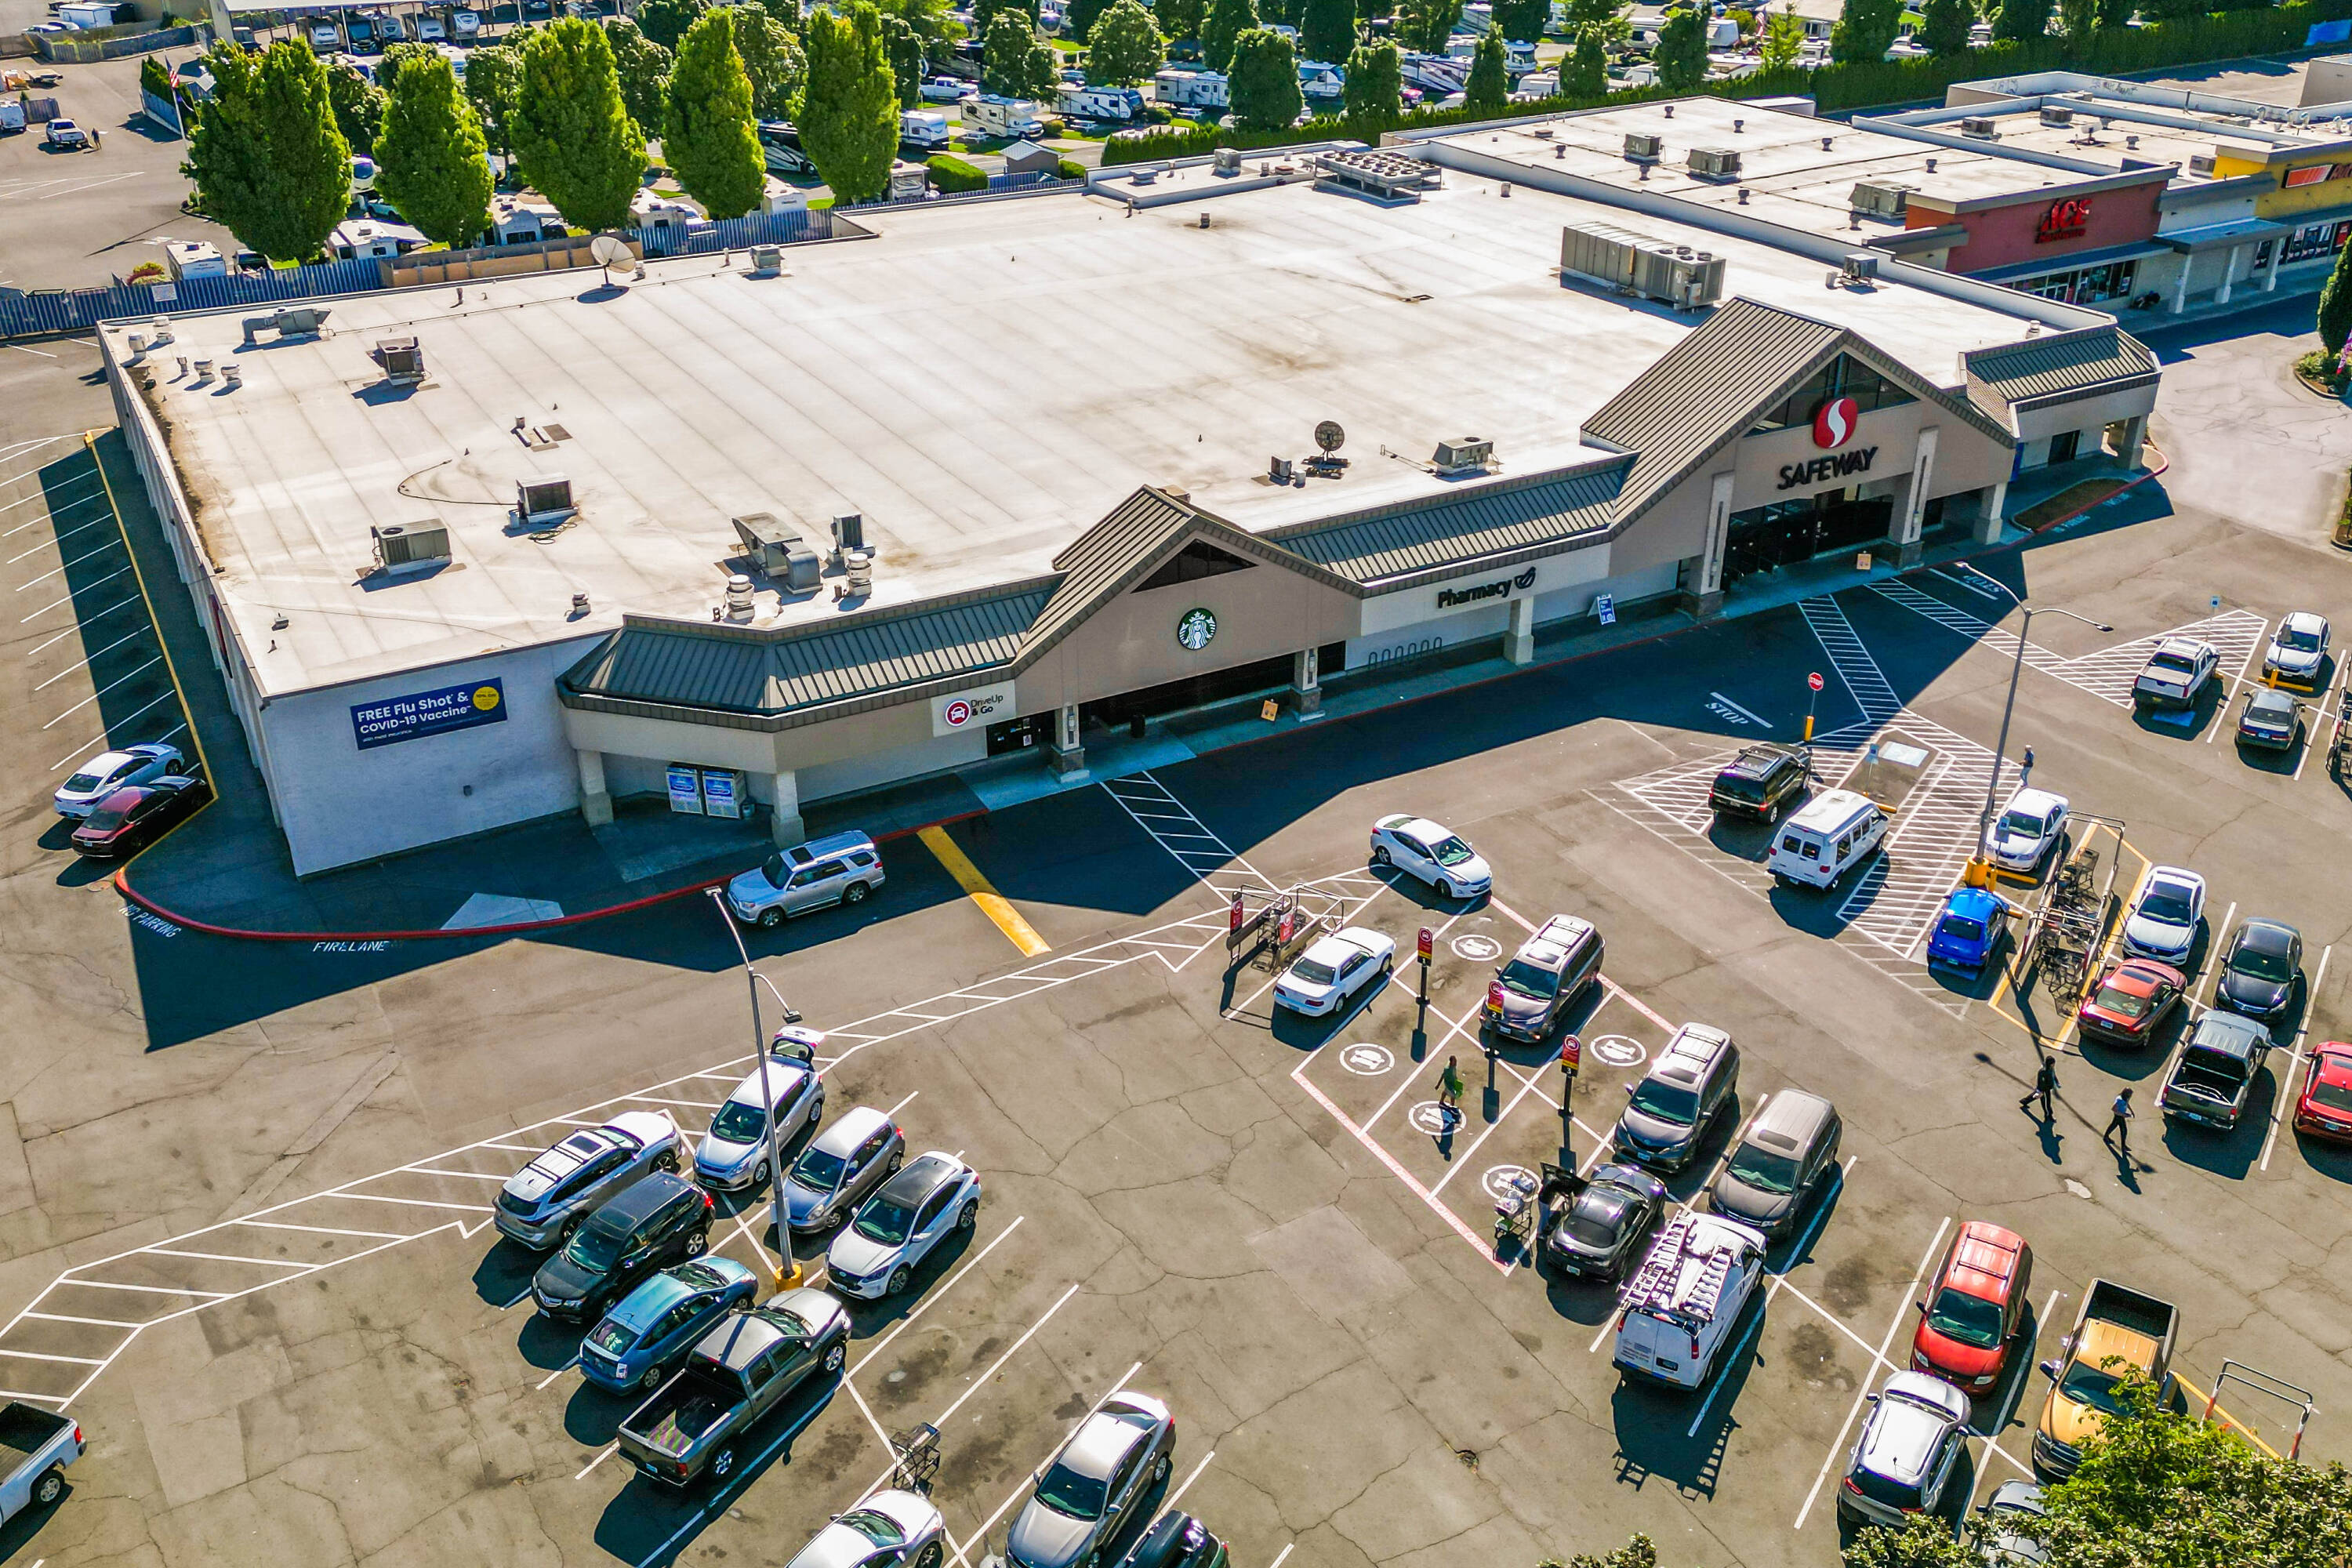
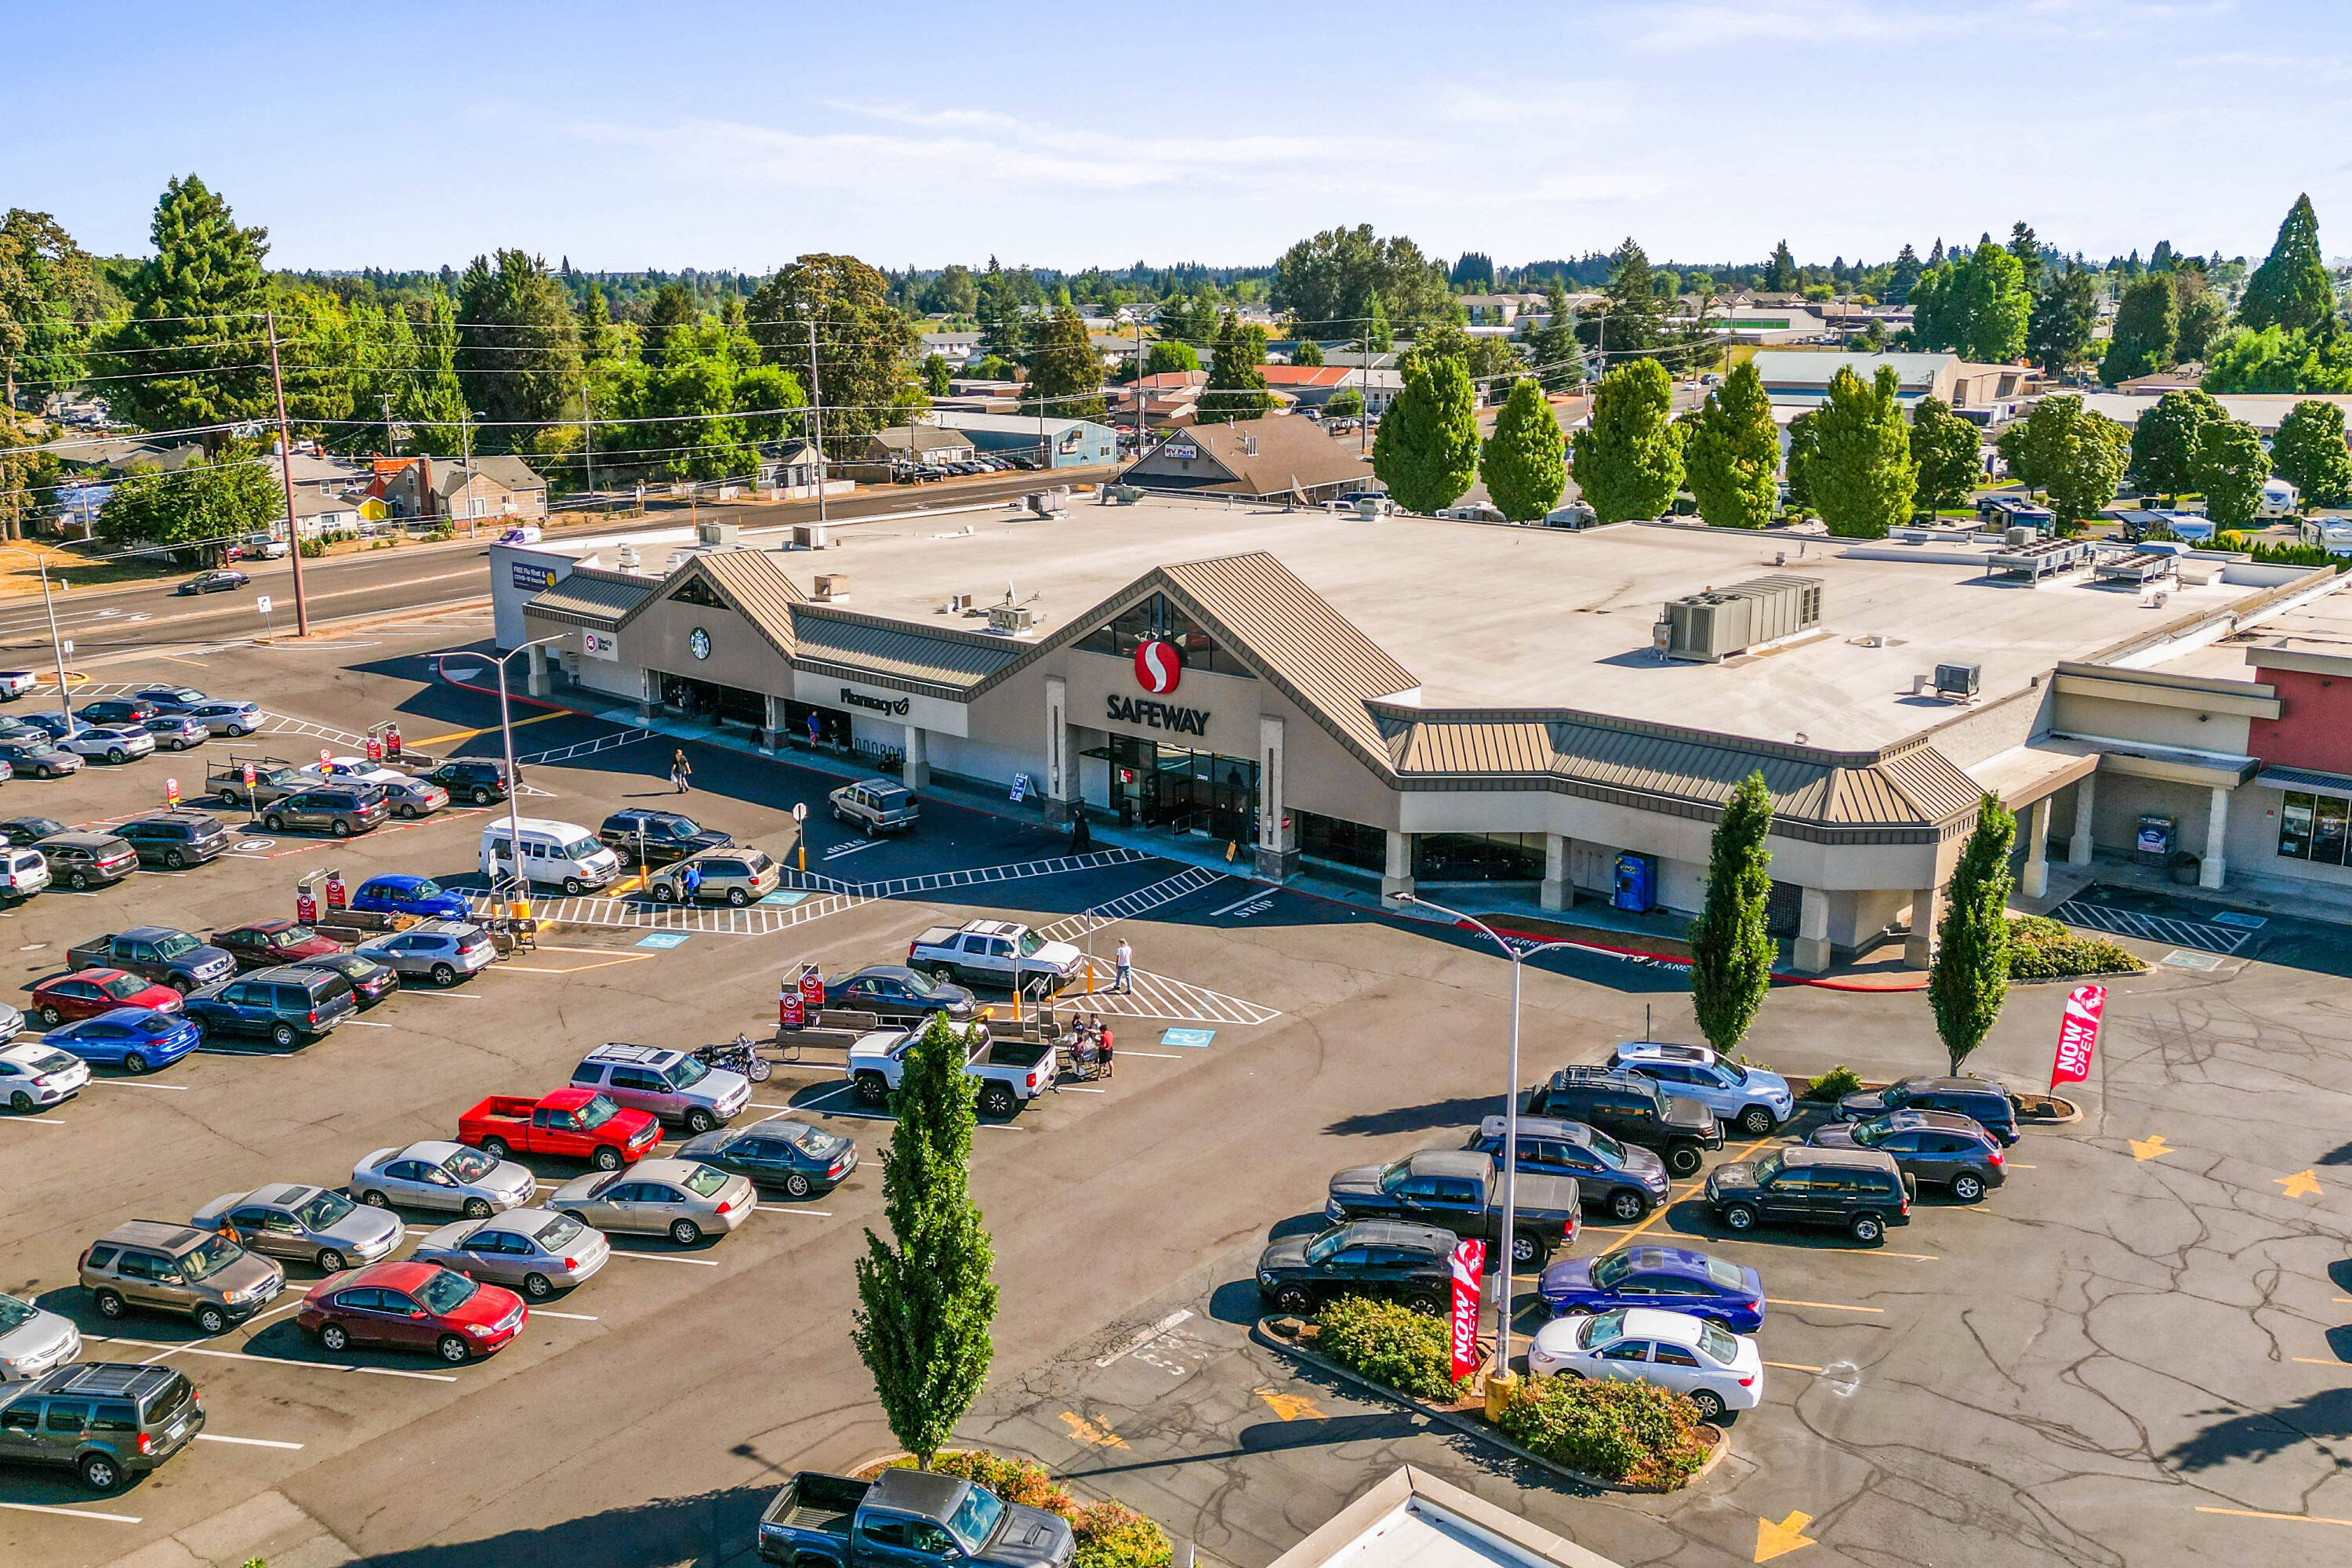
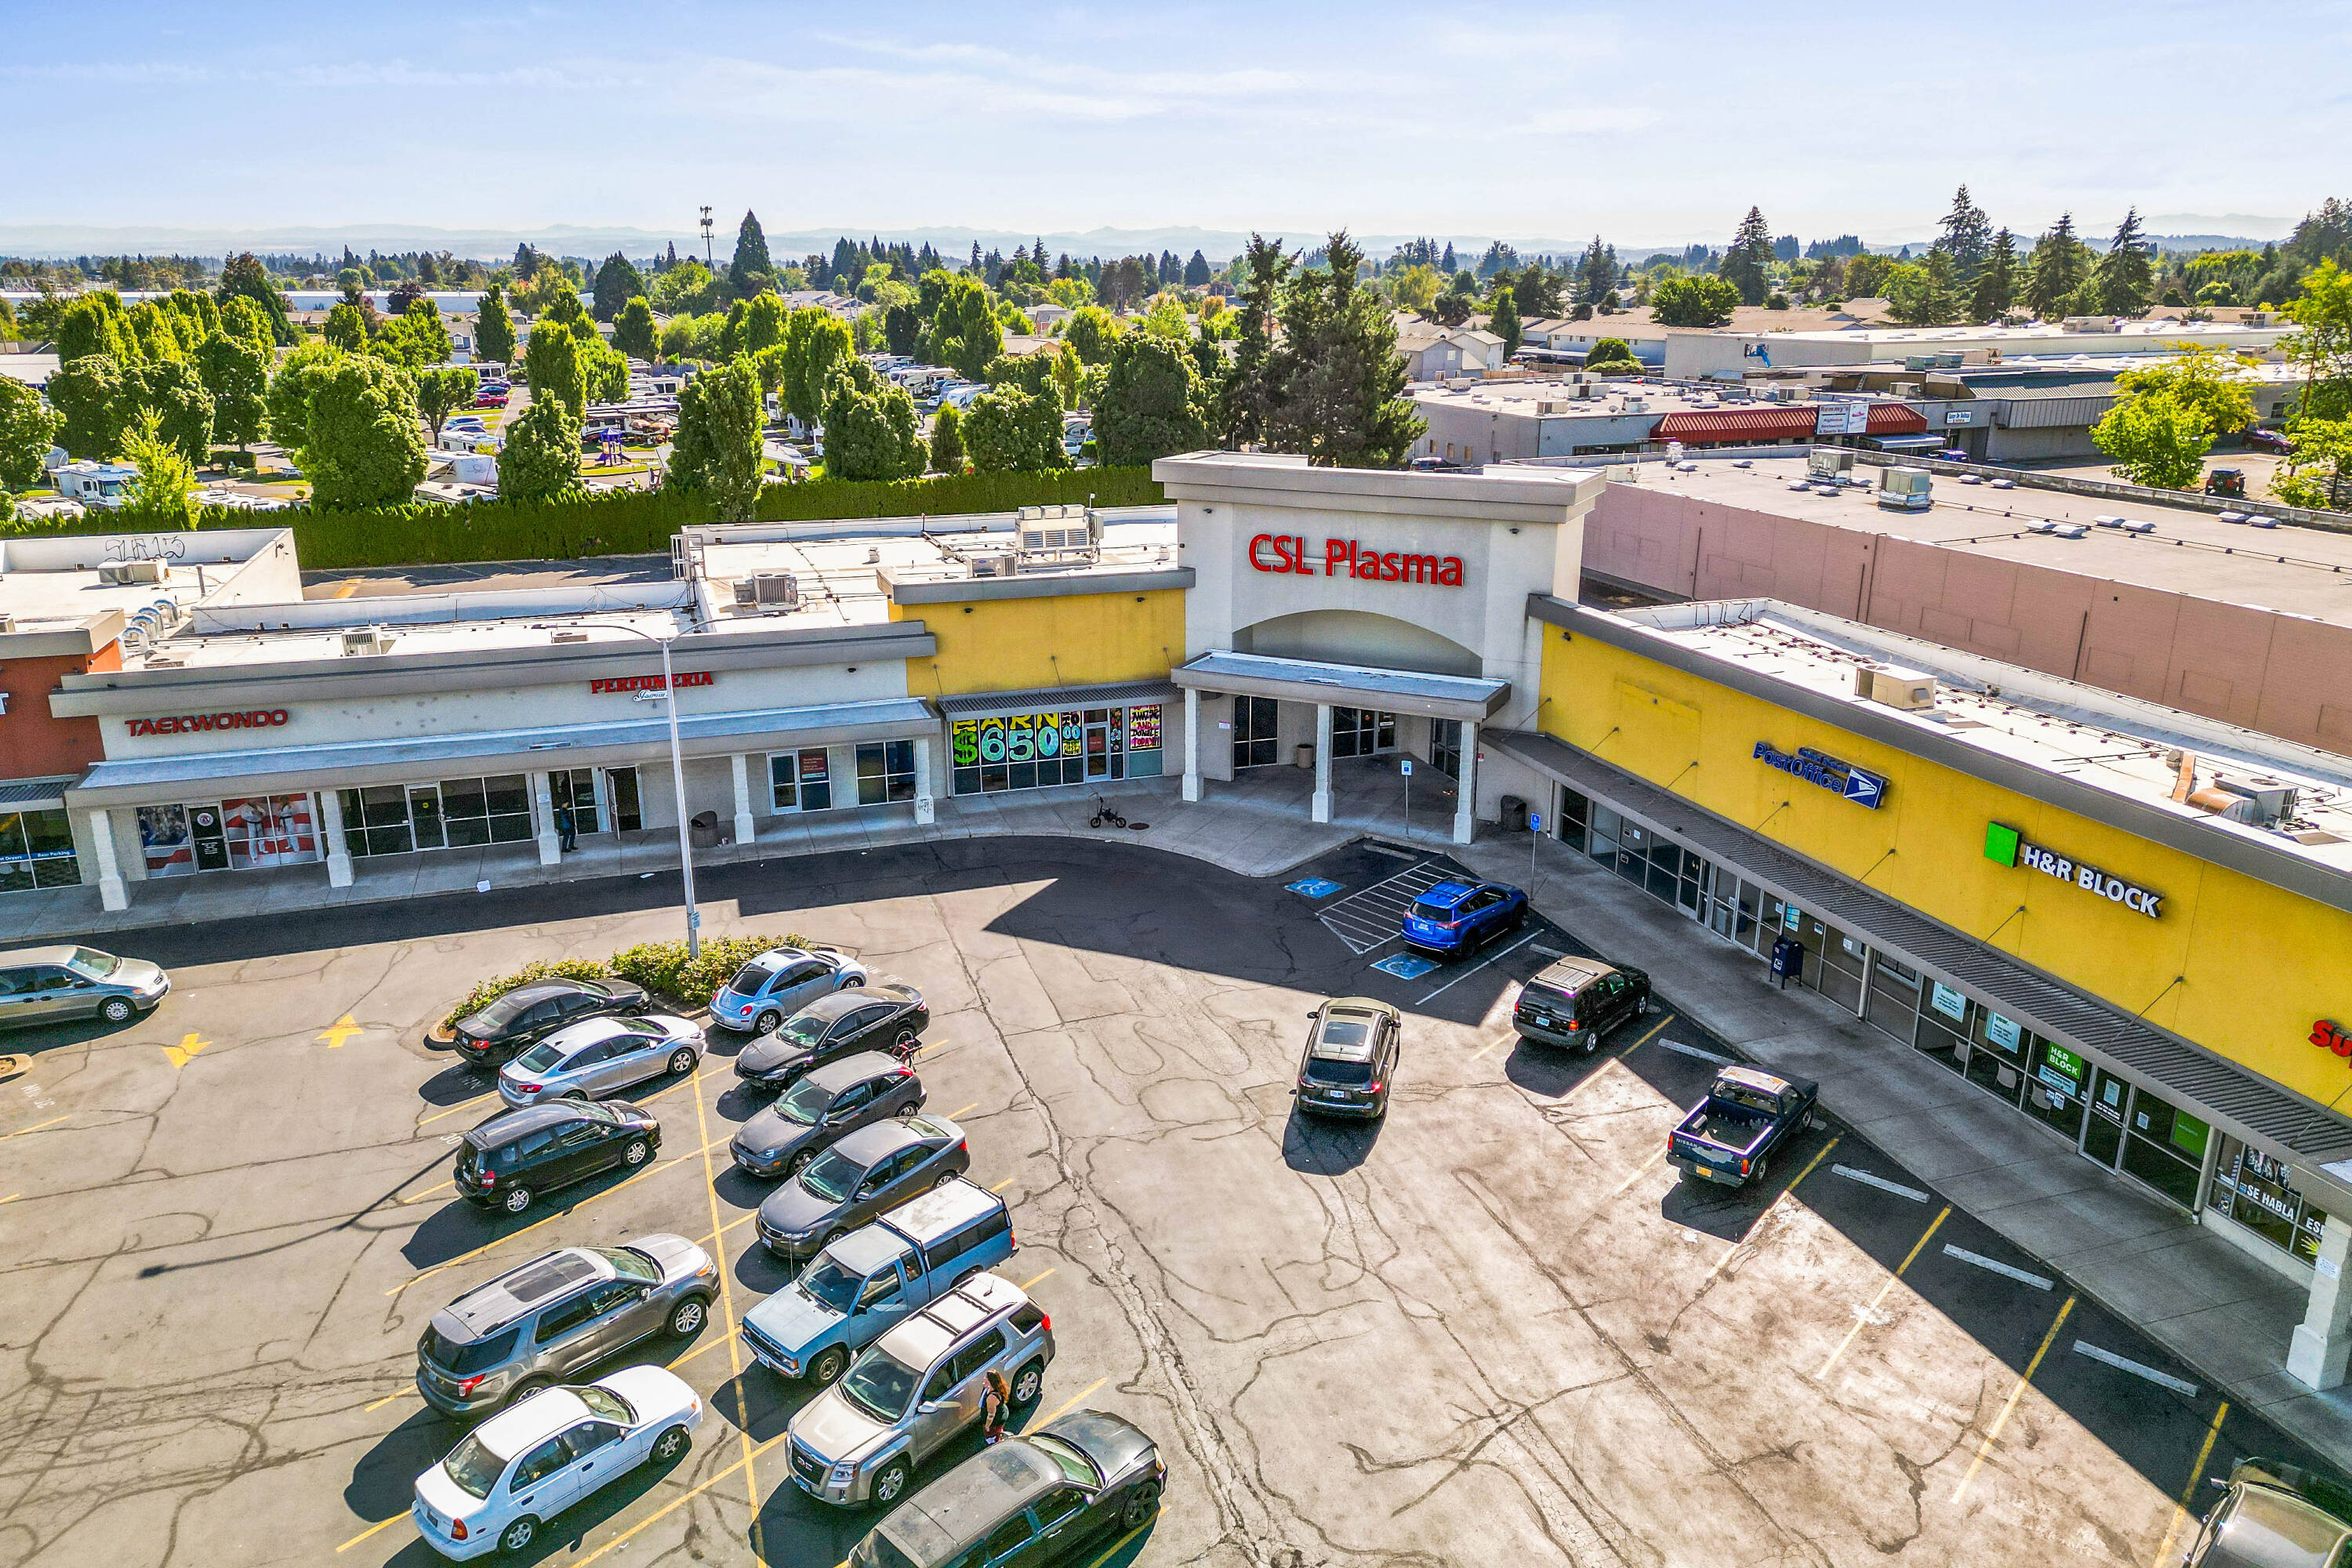
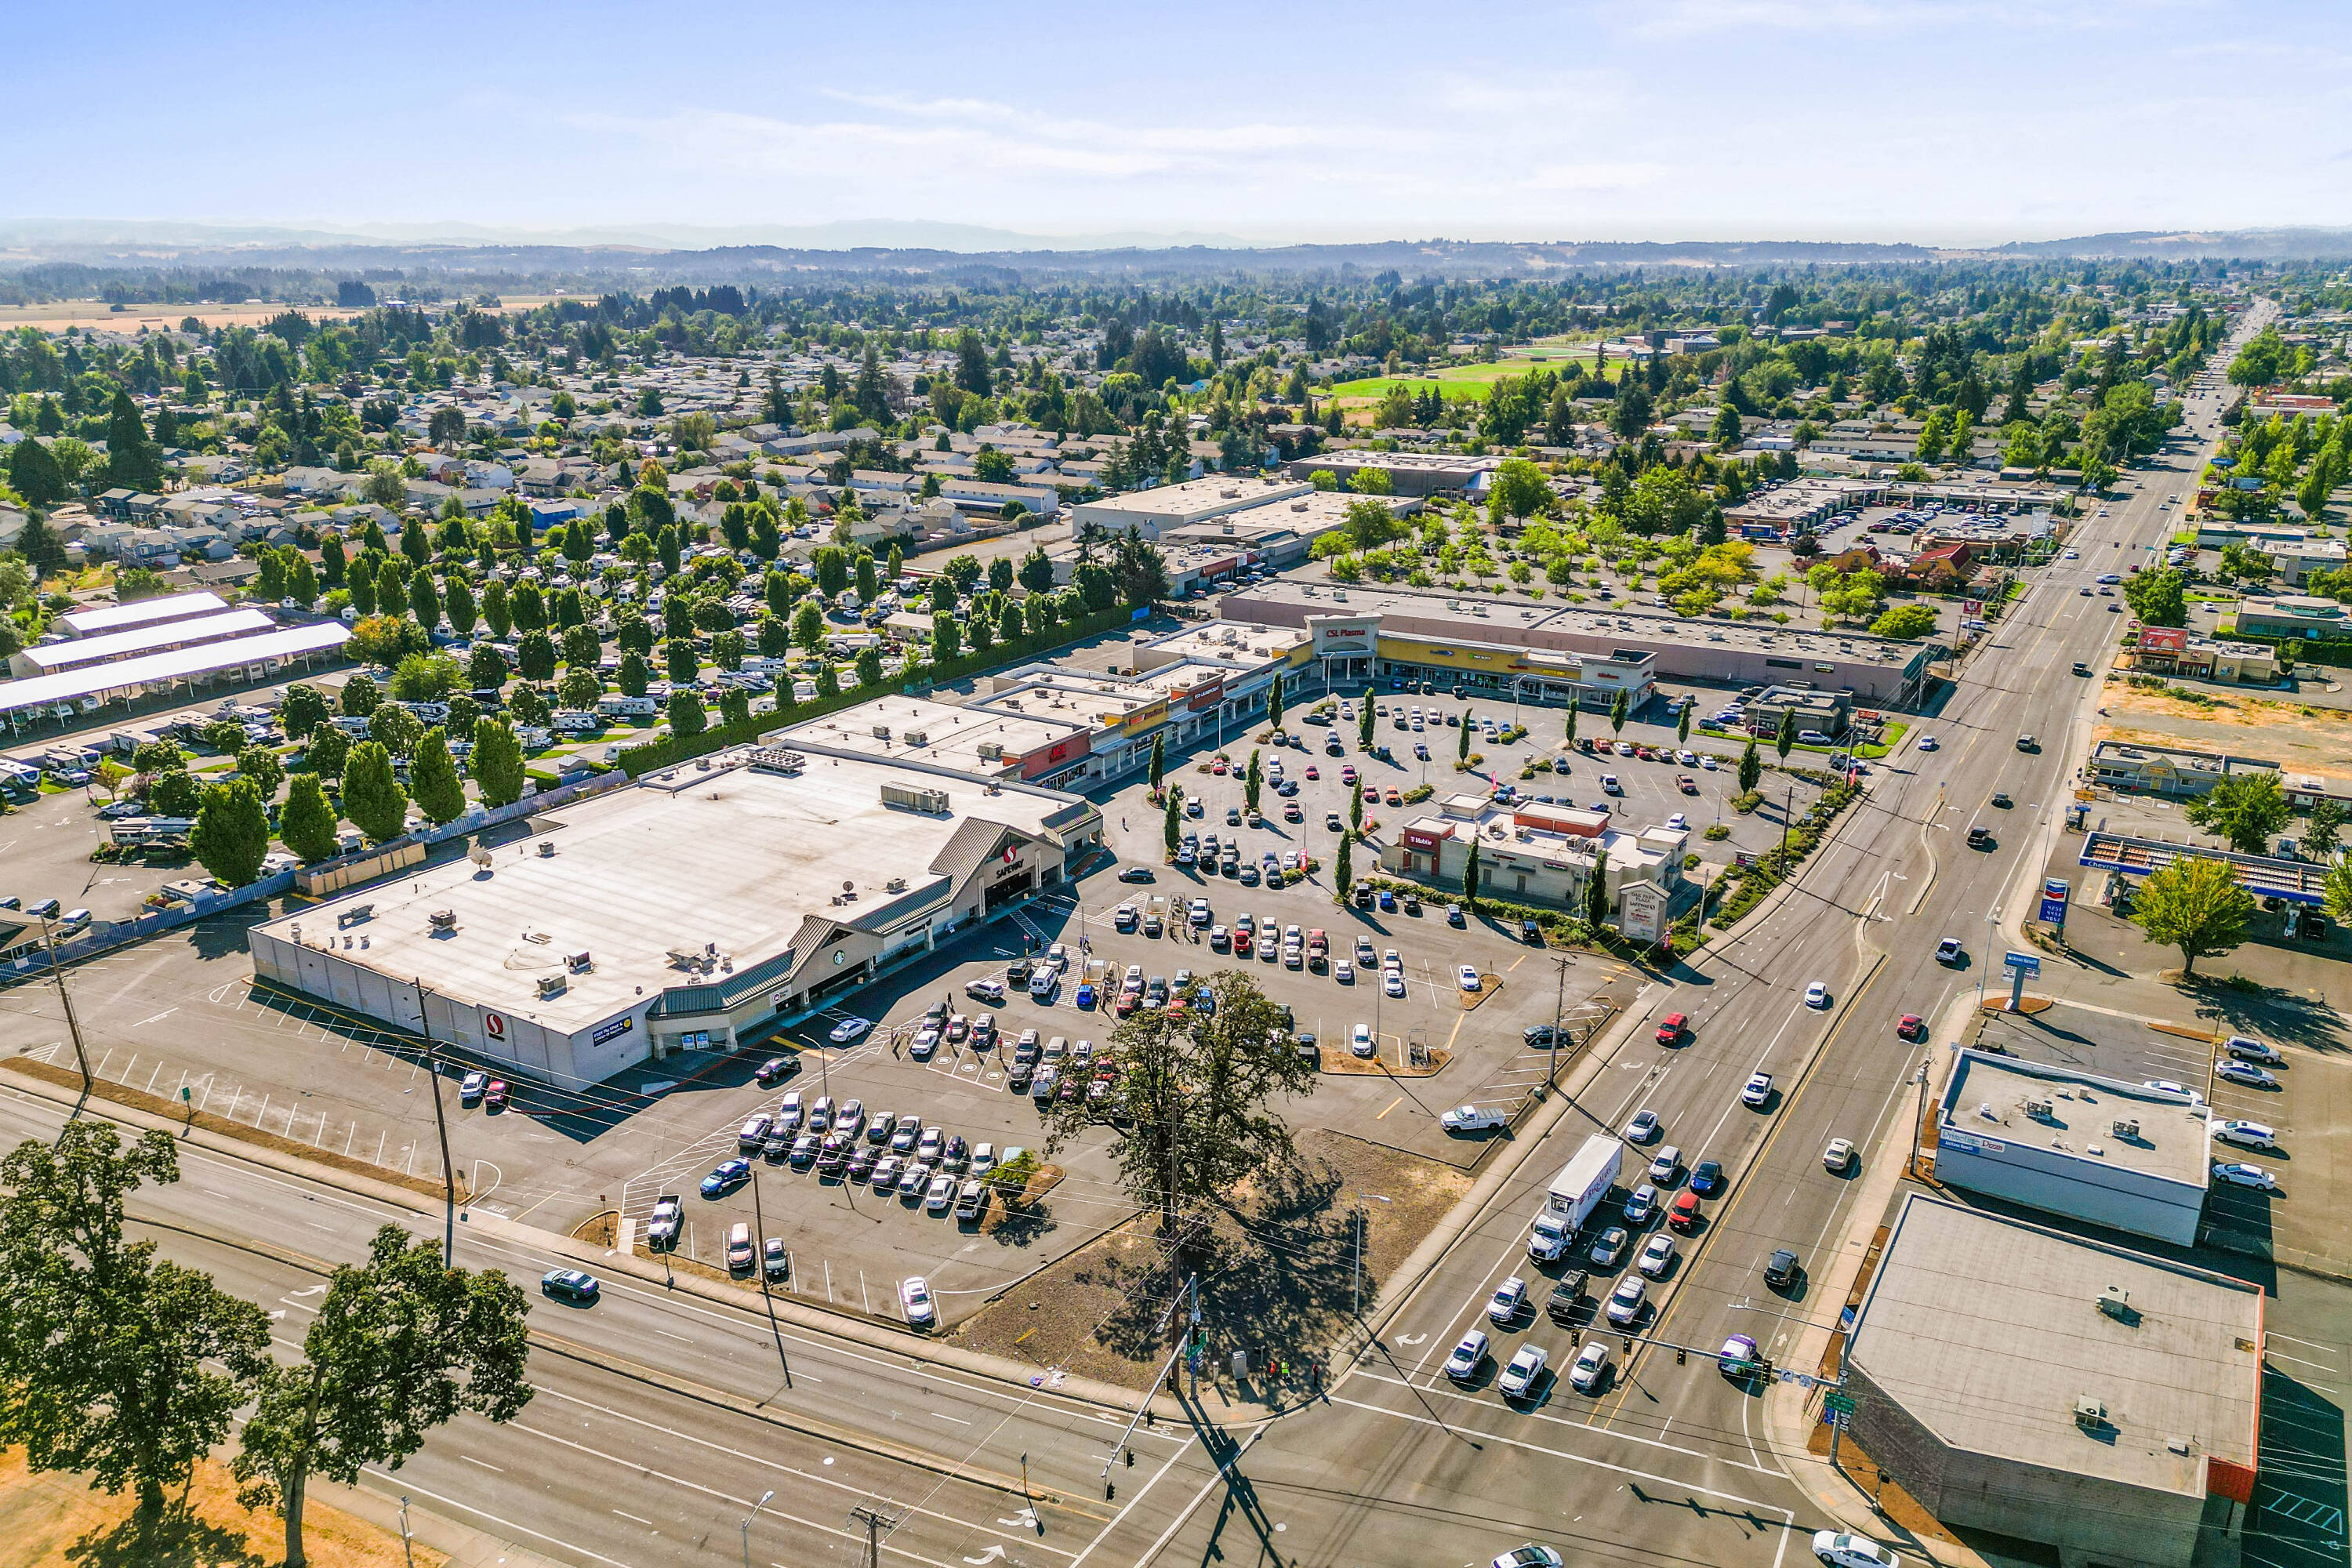
- Safeway‑anchored neighborhood retail center.
- Located on busy Lancaster Dr. NE in the expanding Northeast Salem trade area.
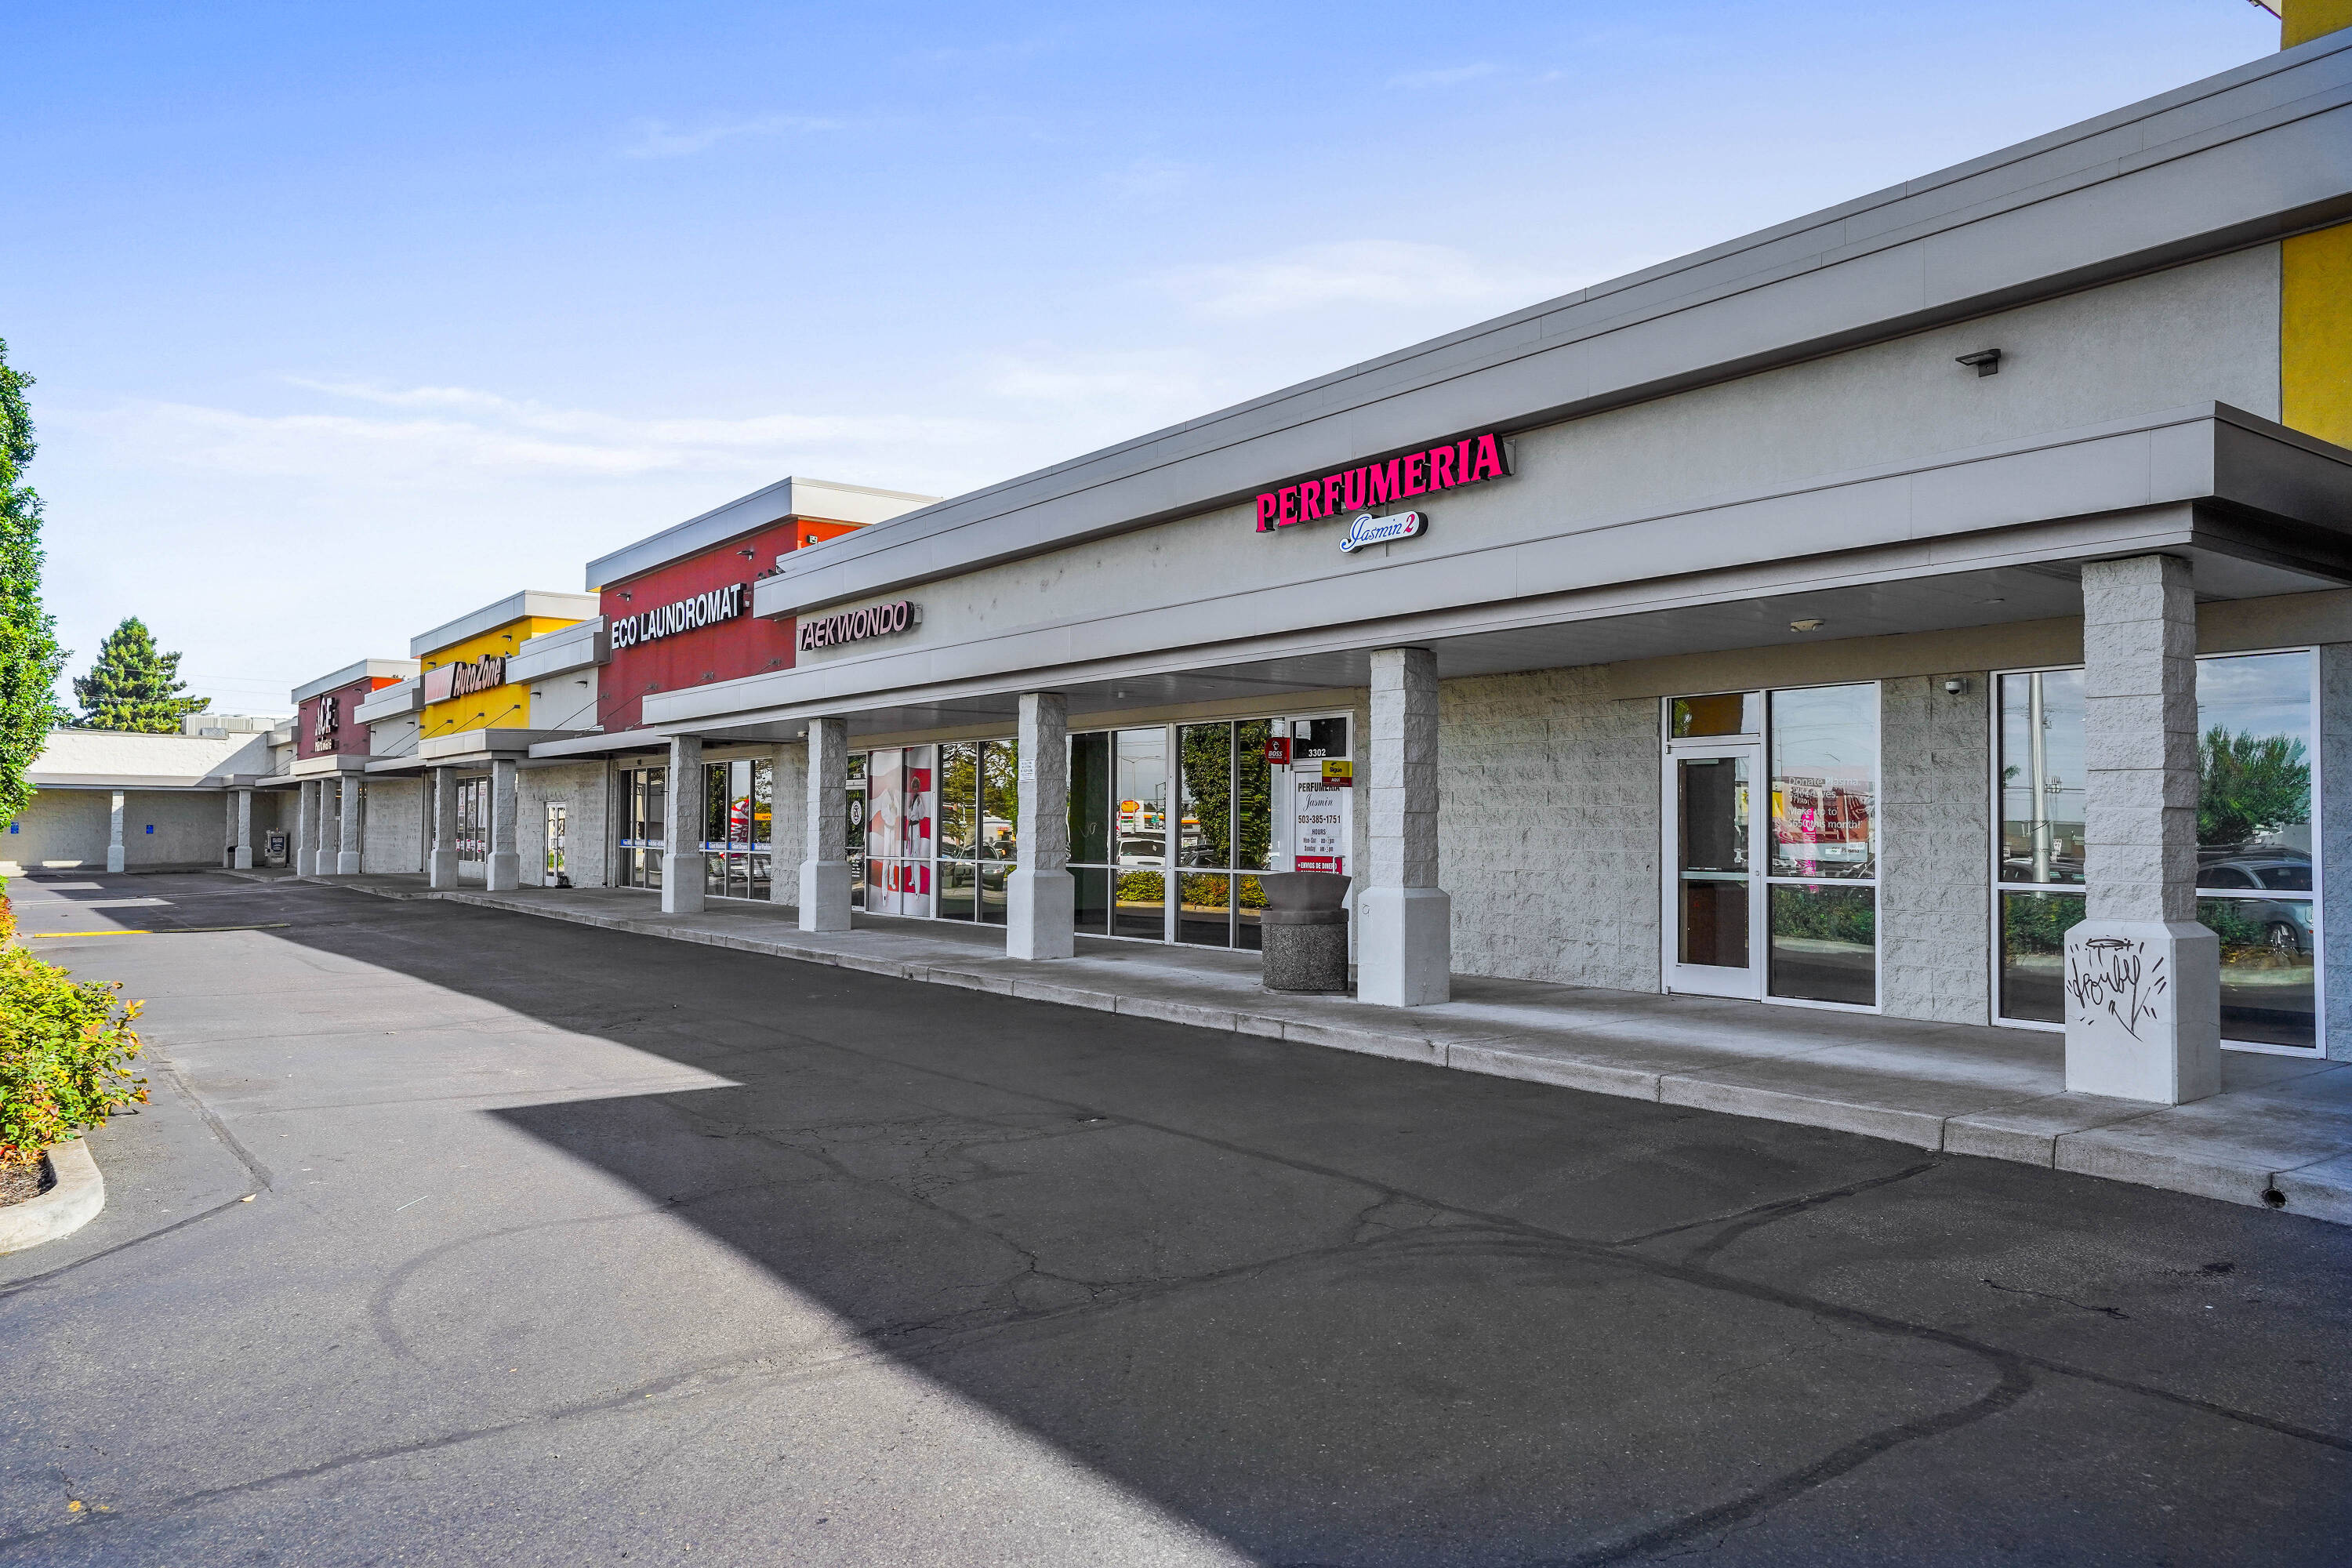
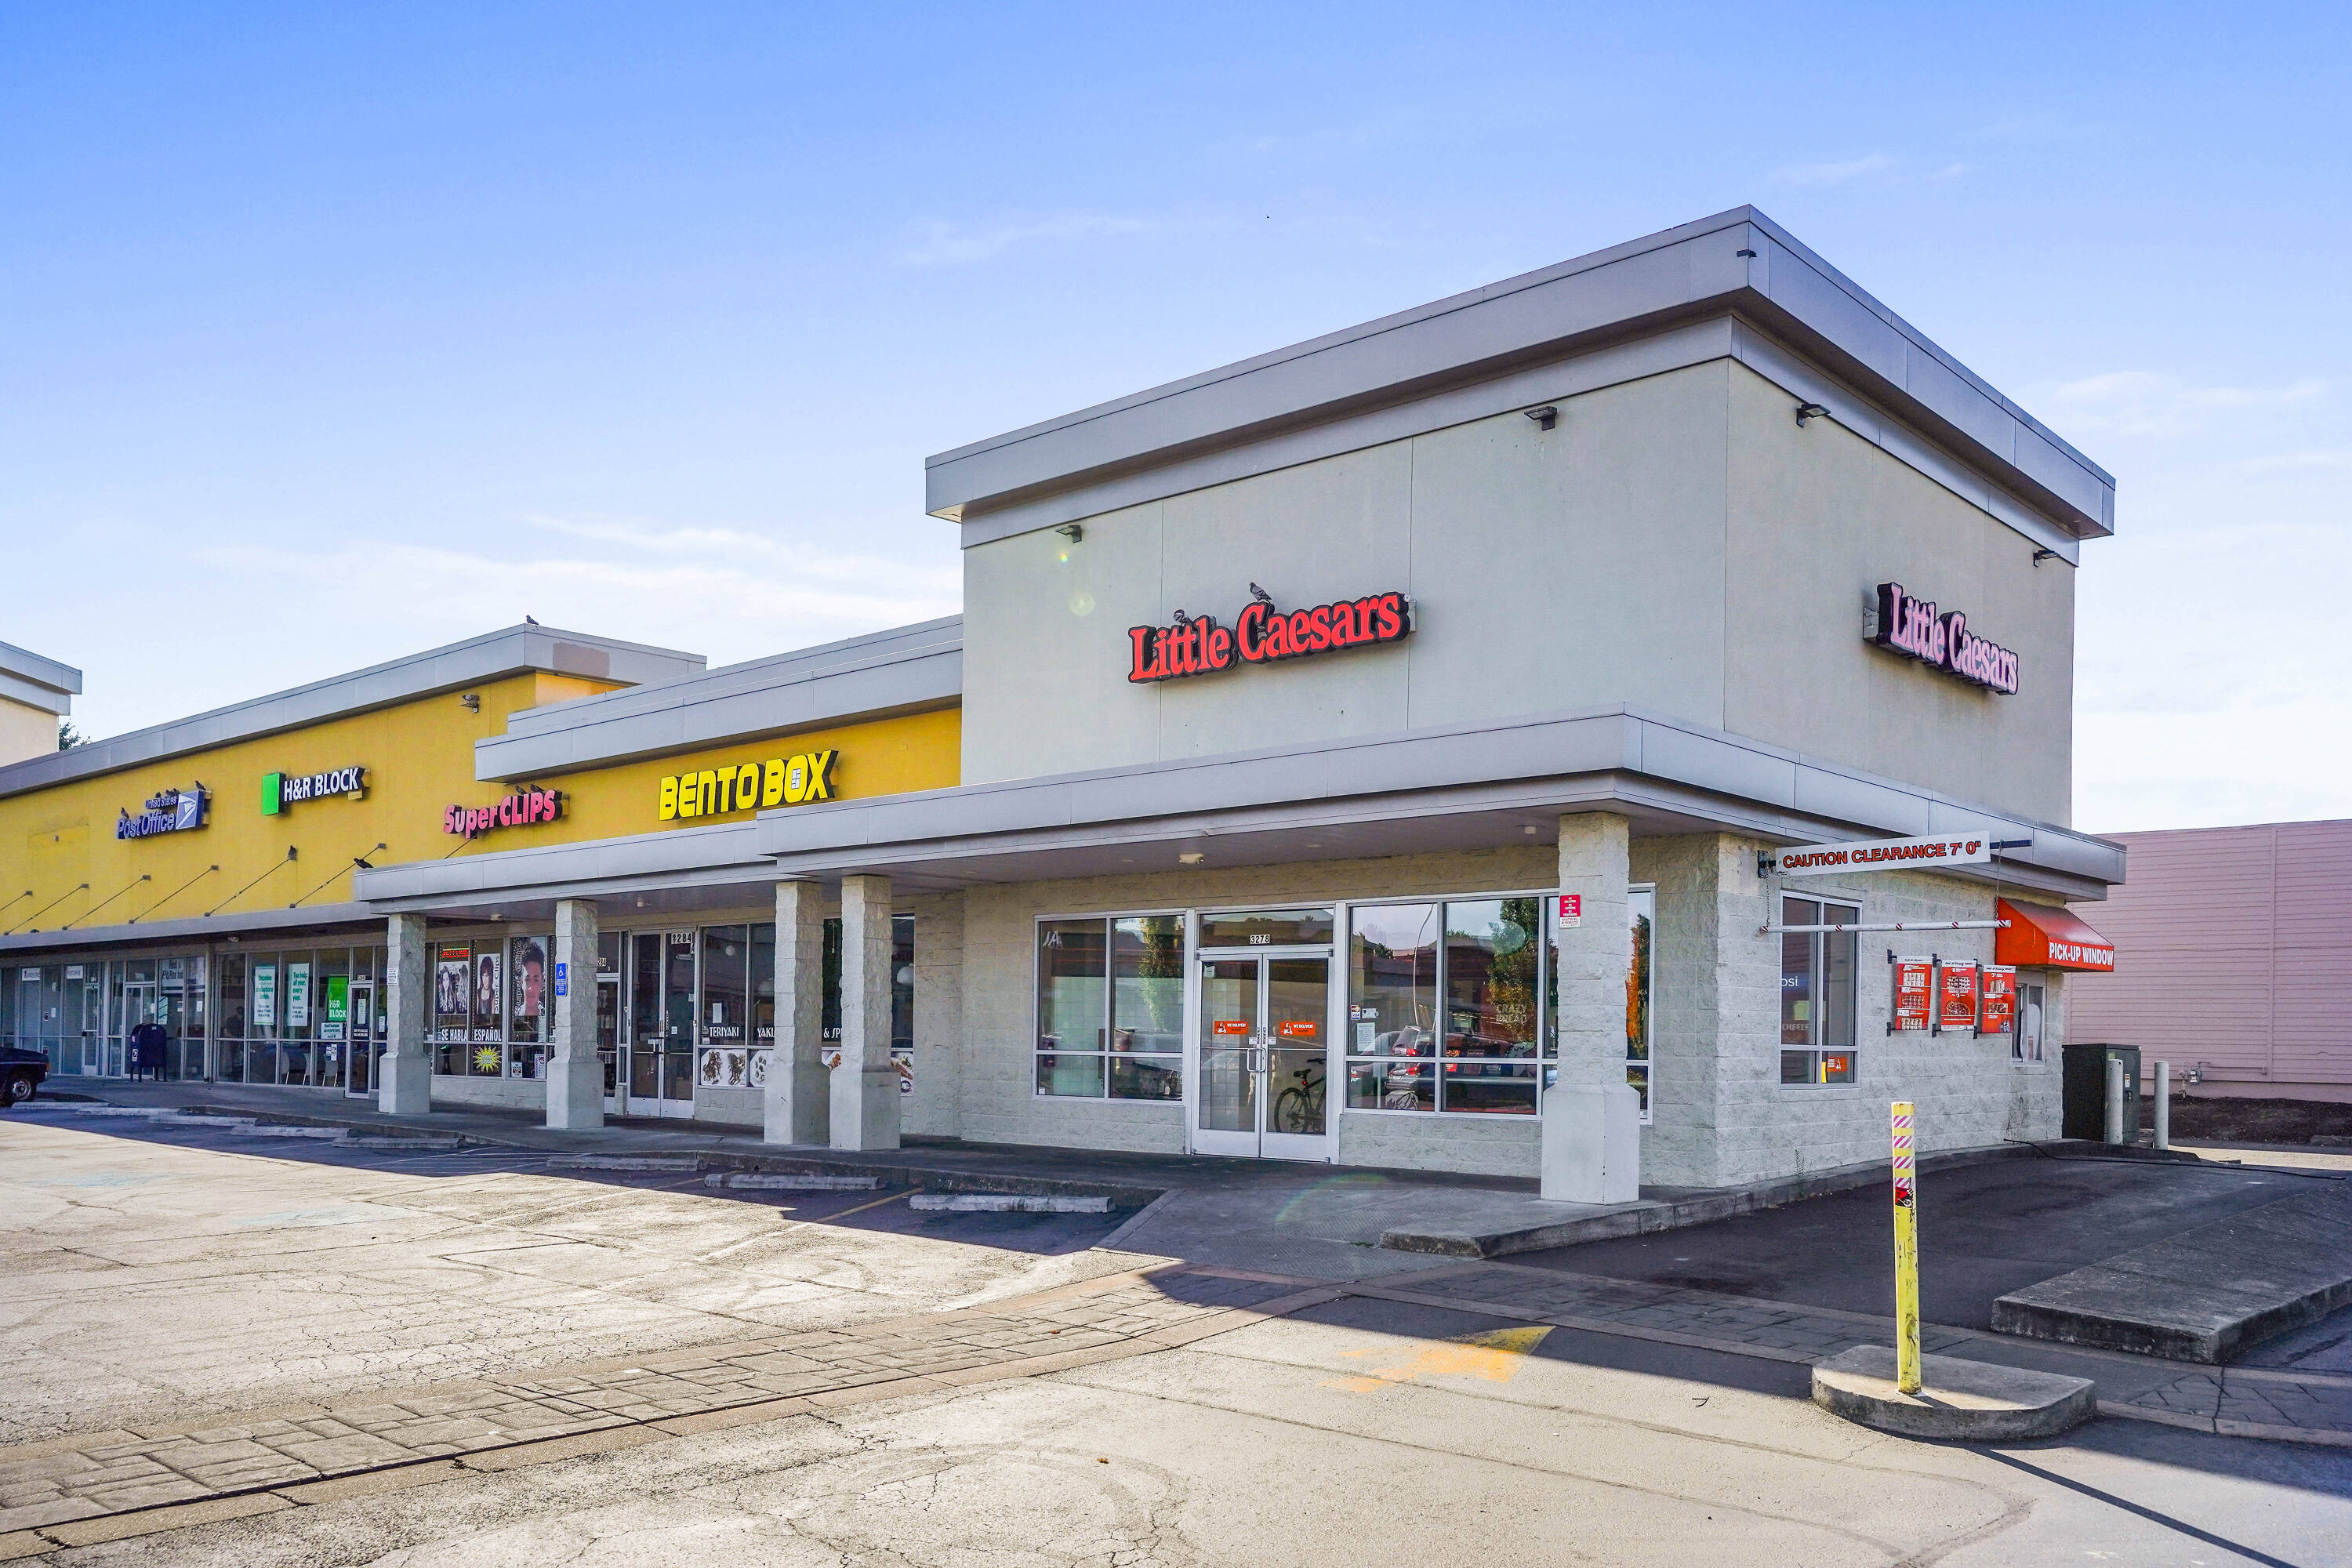
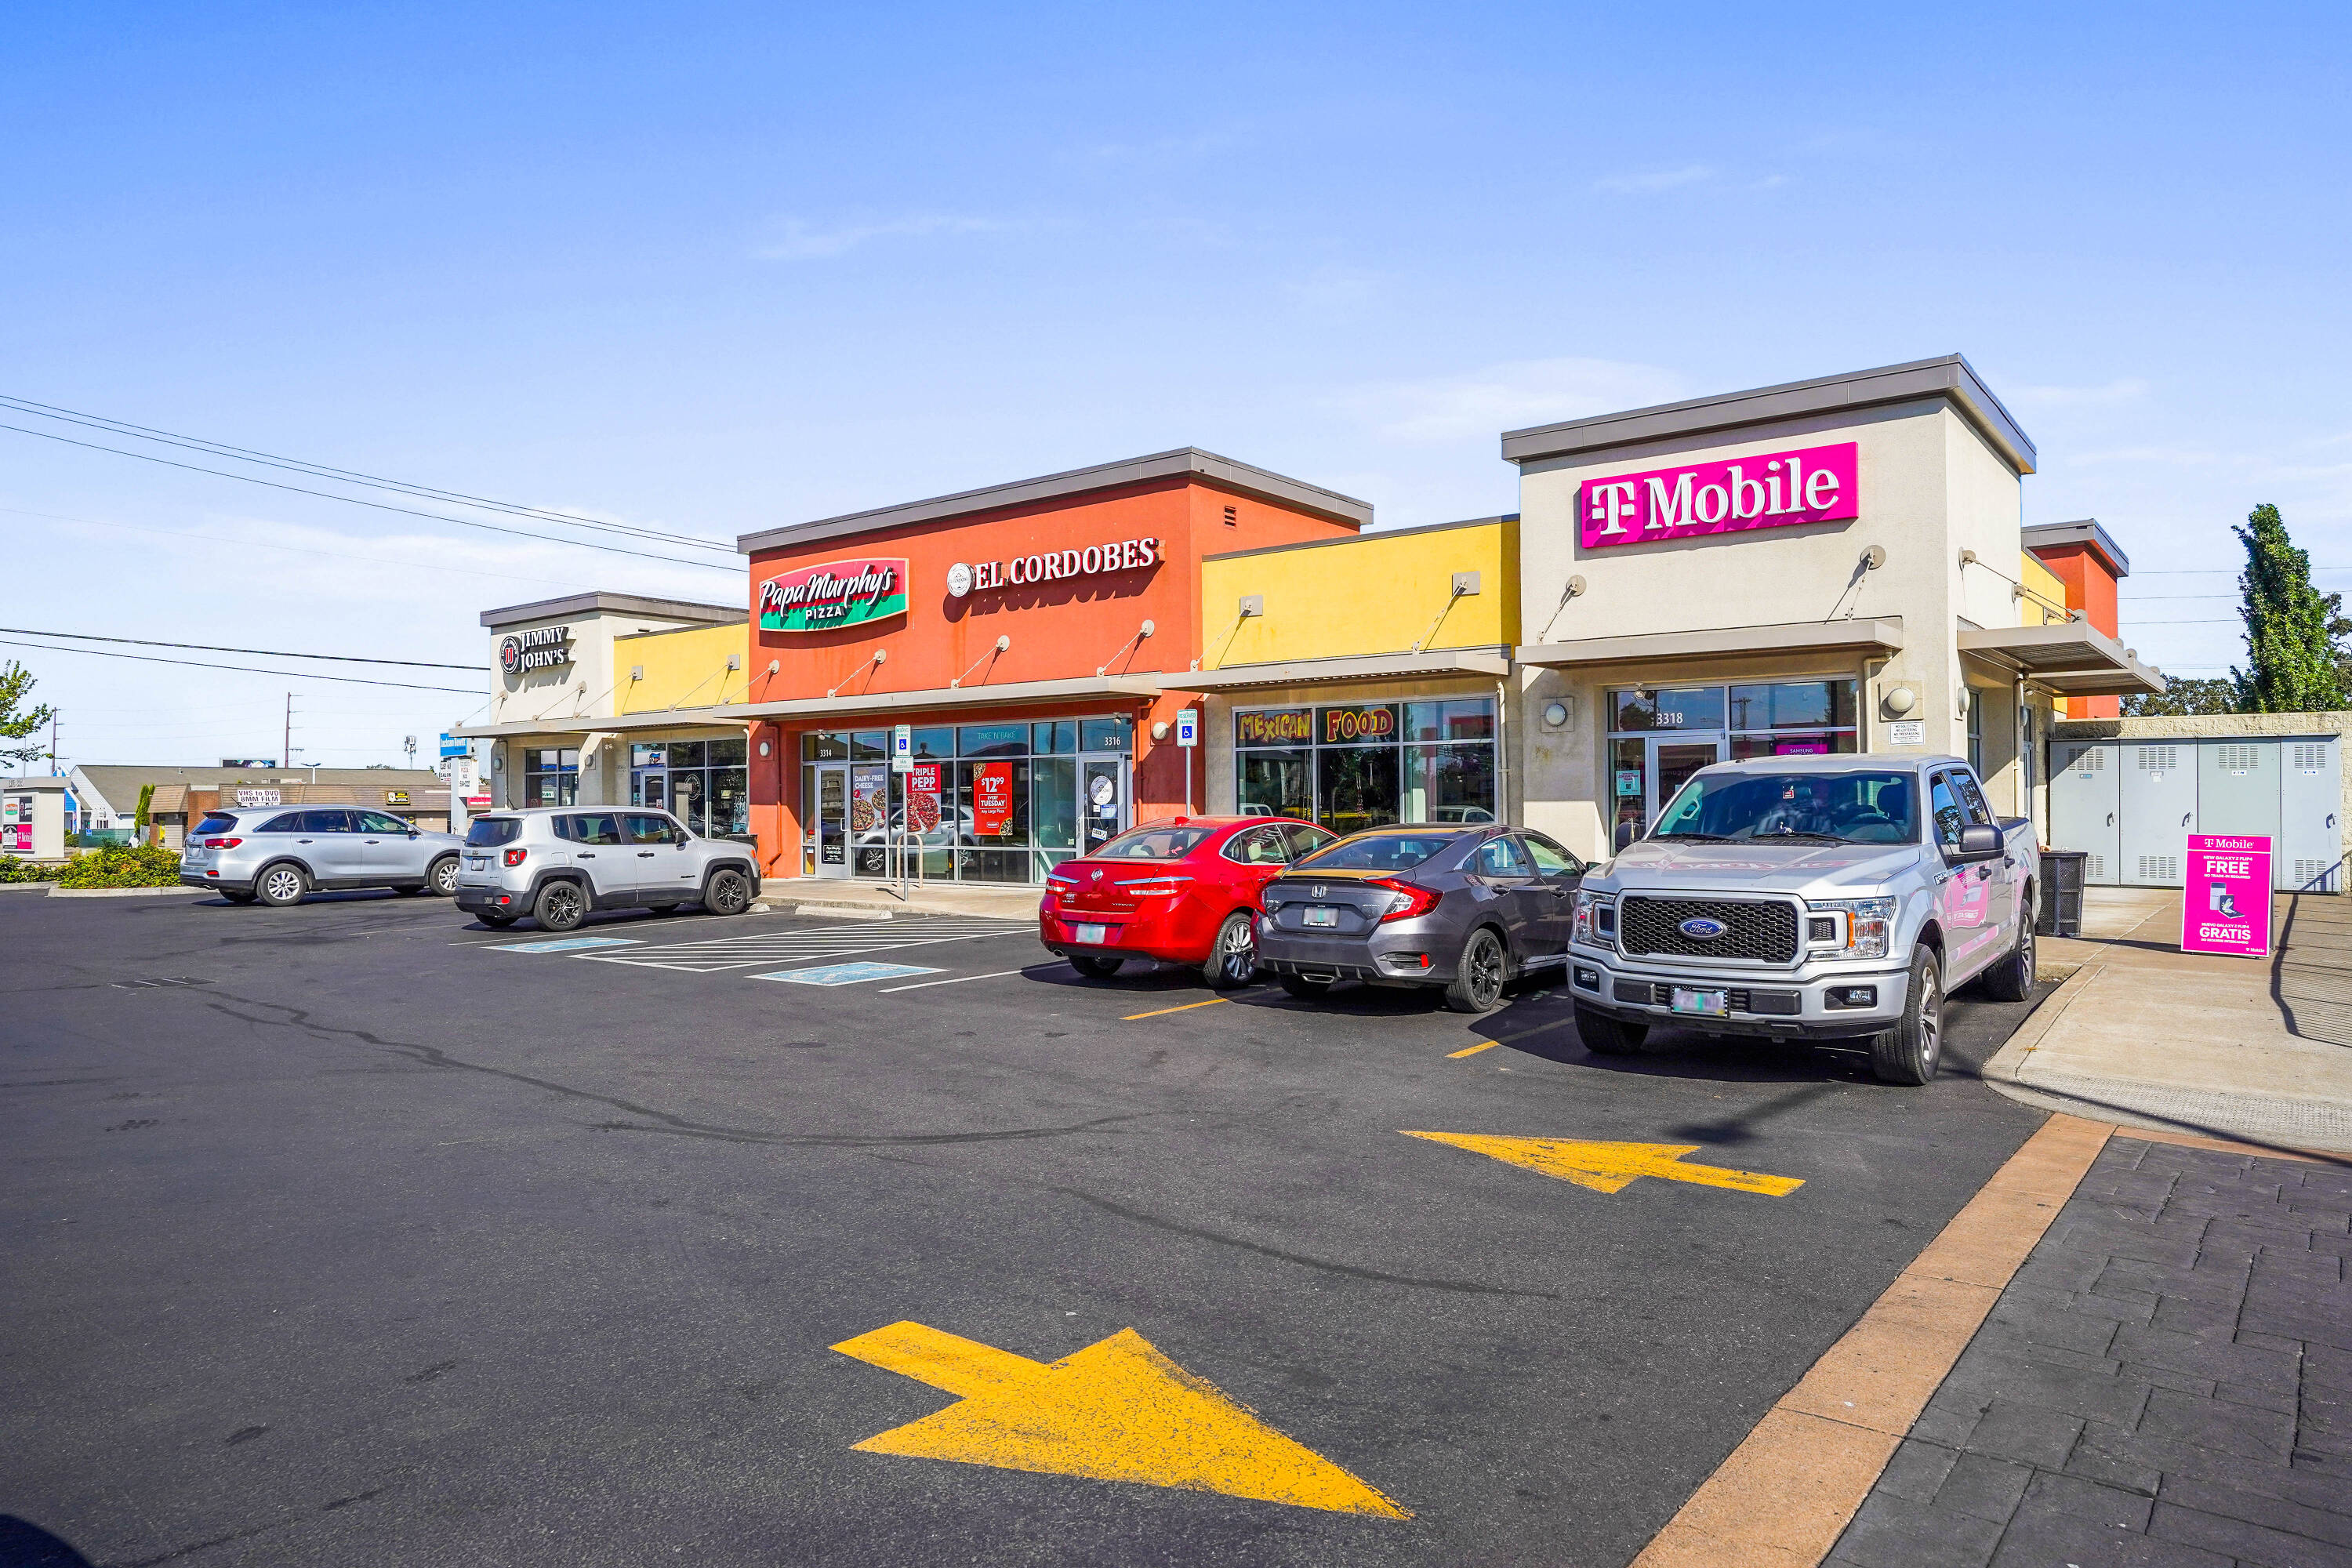
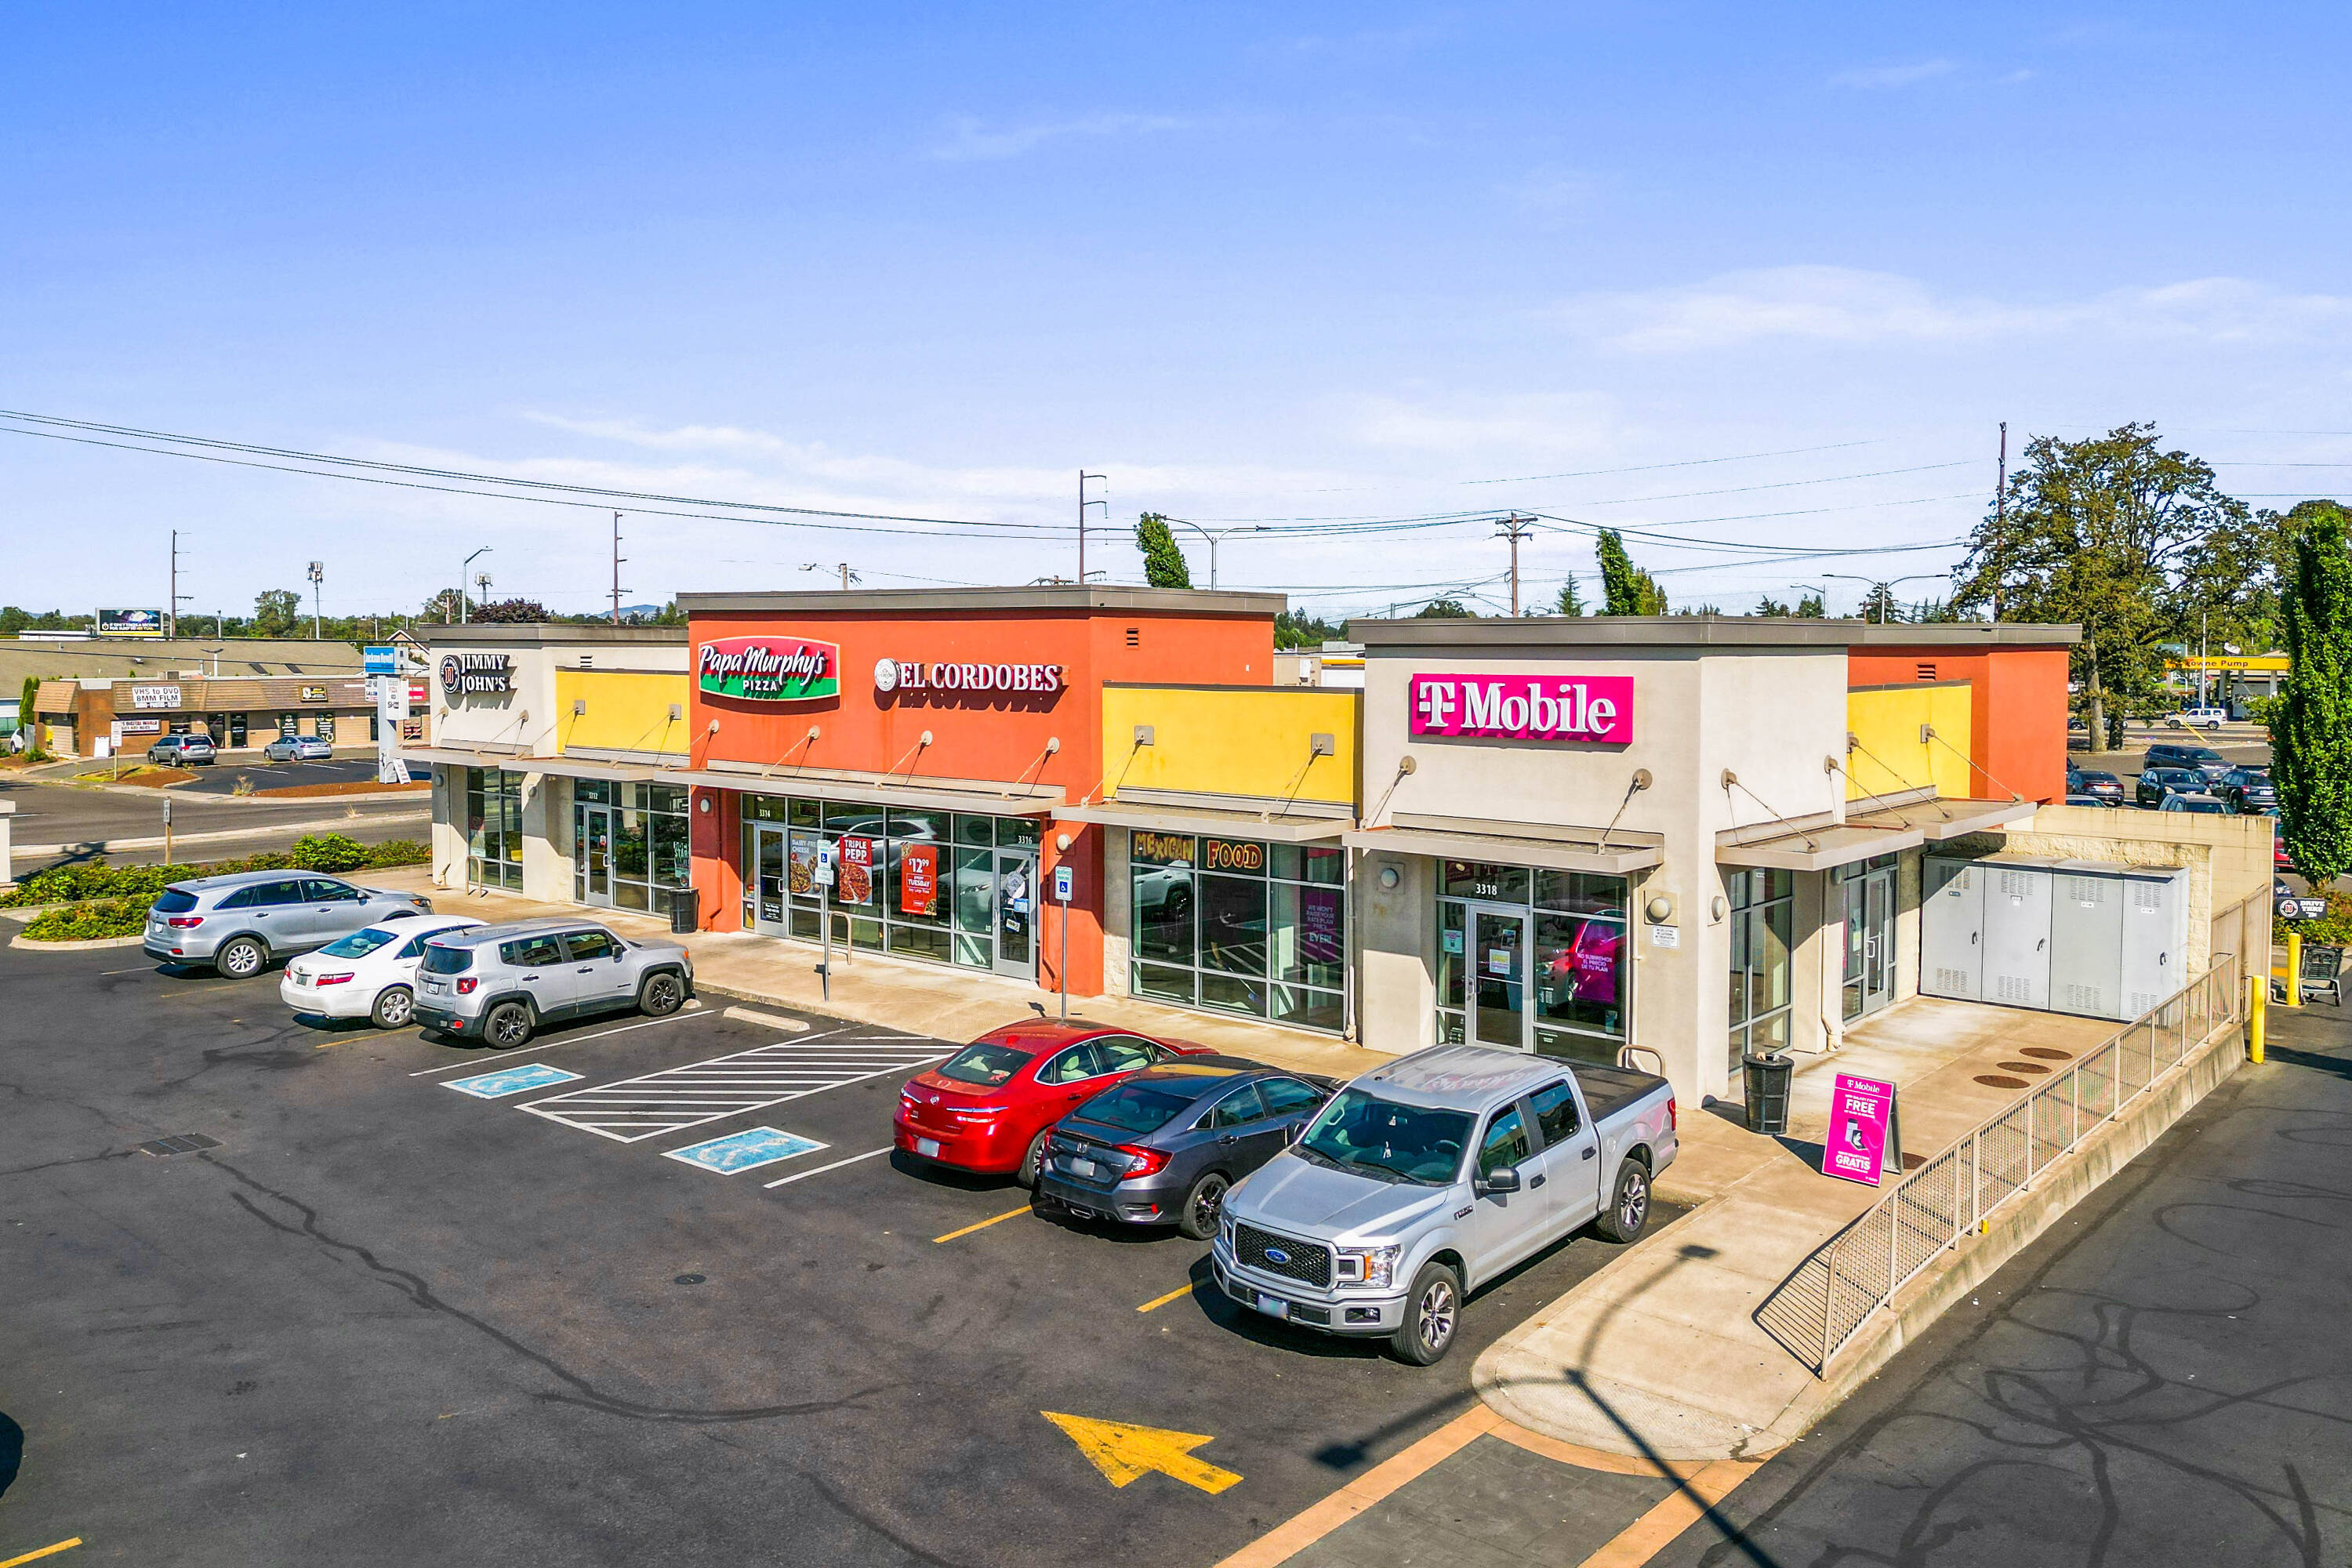
- Extensively remodeled in 2012 with a new multi‑tenant pad building completed in 2014.
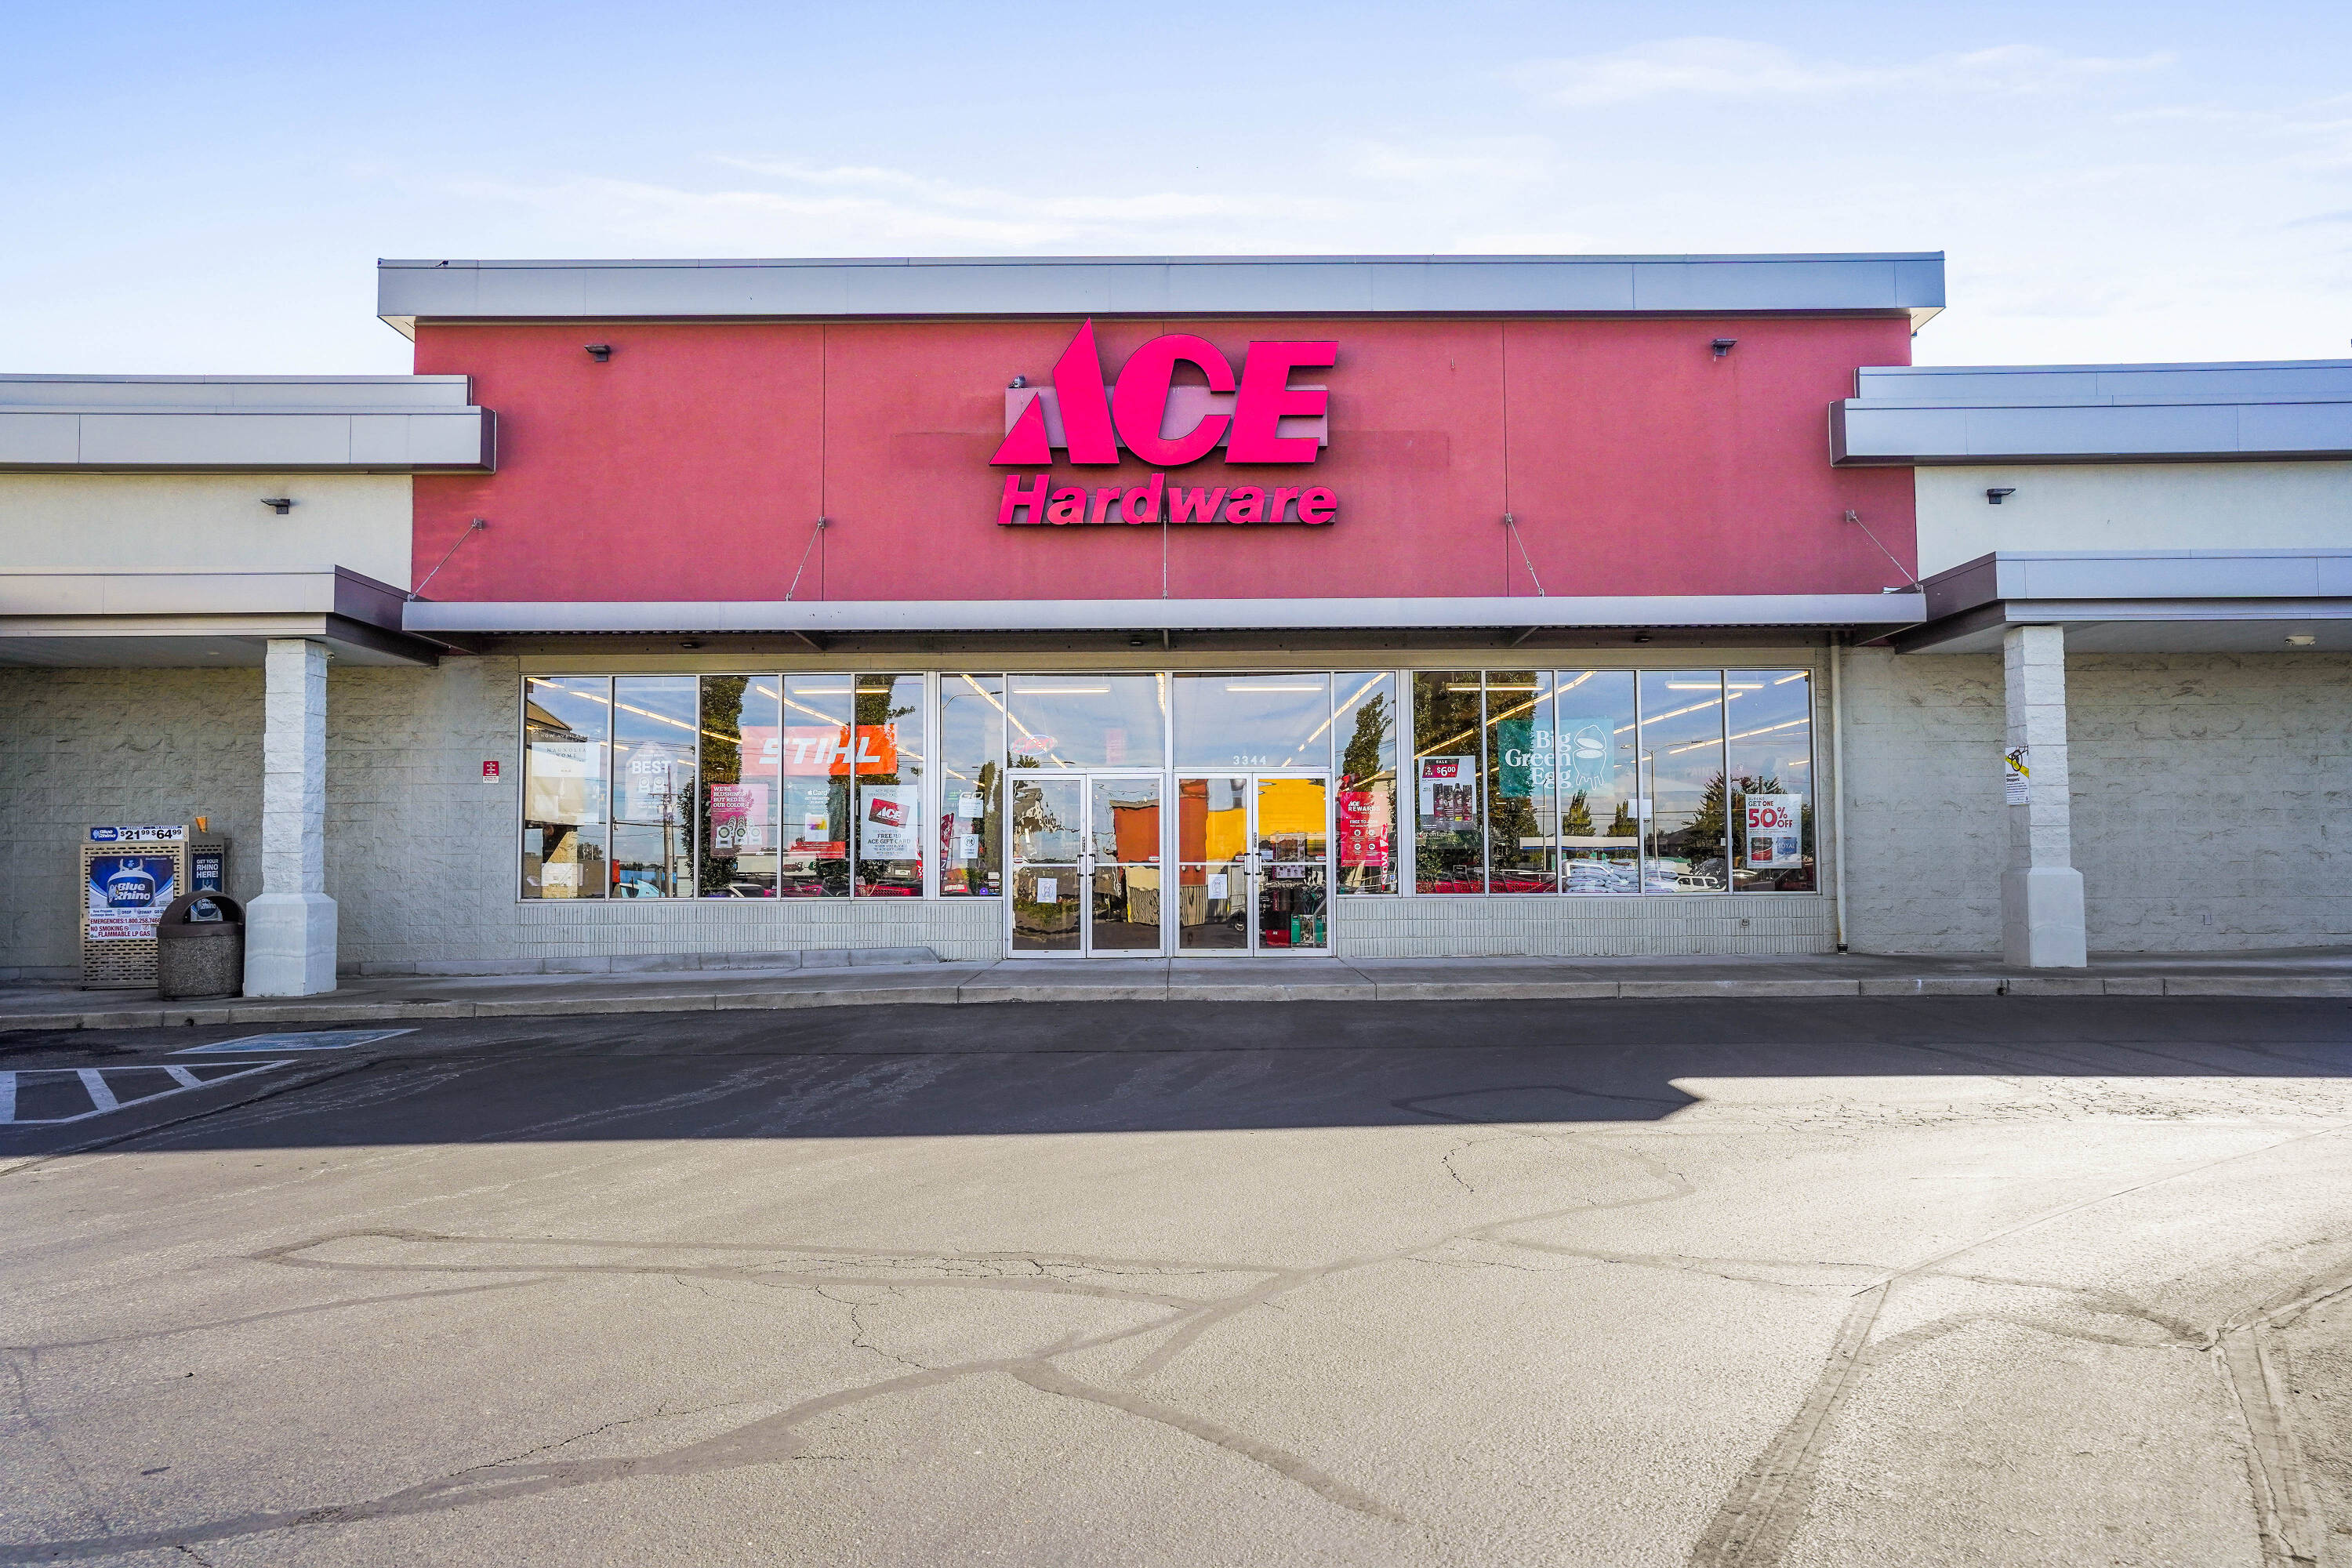
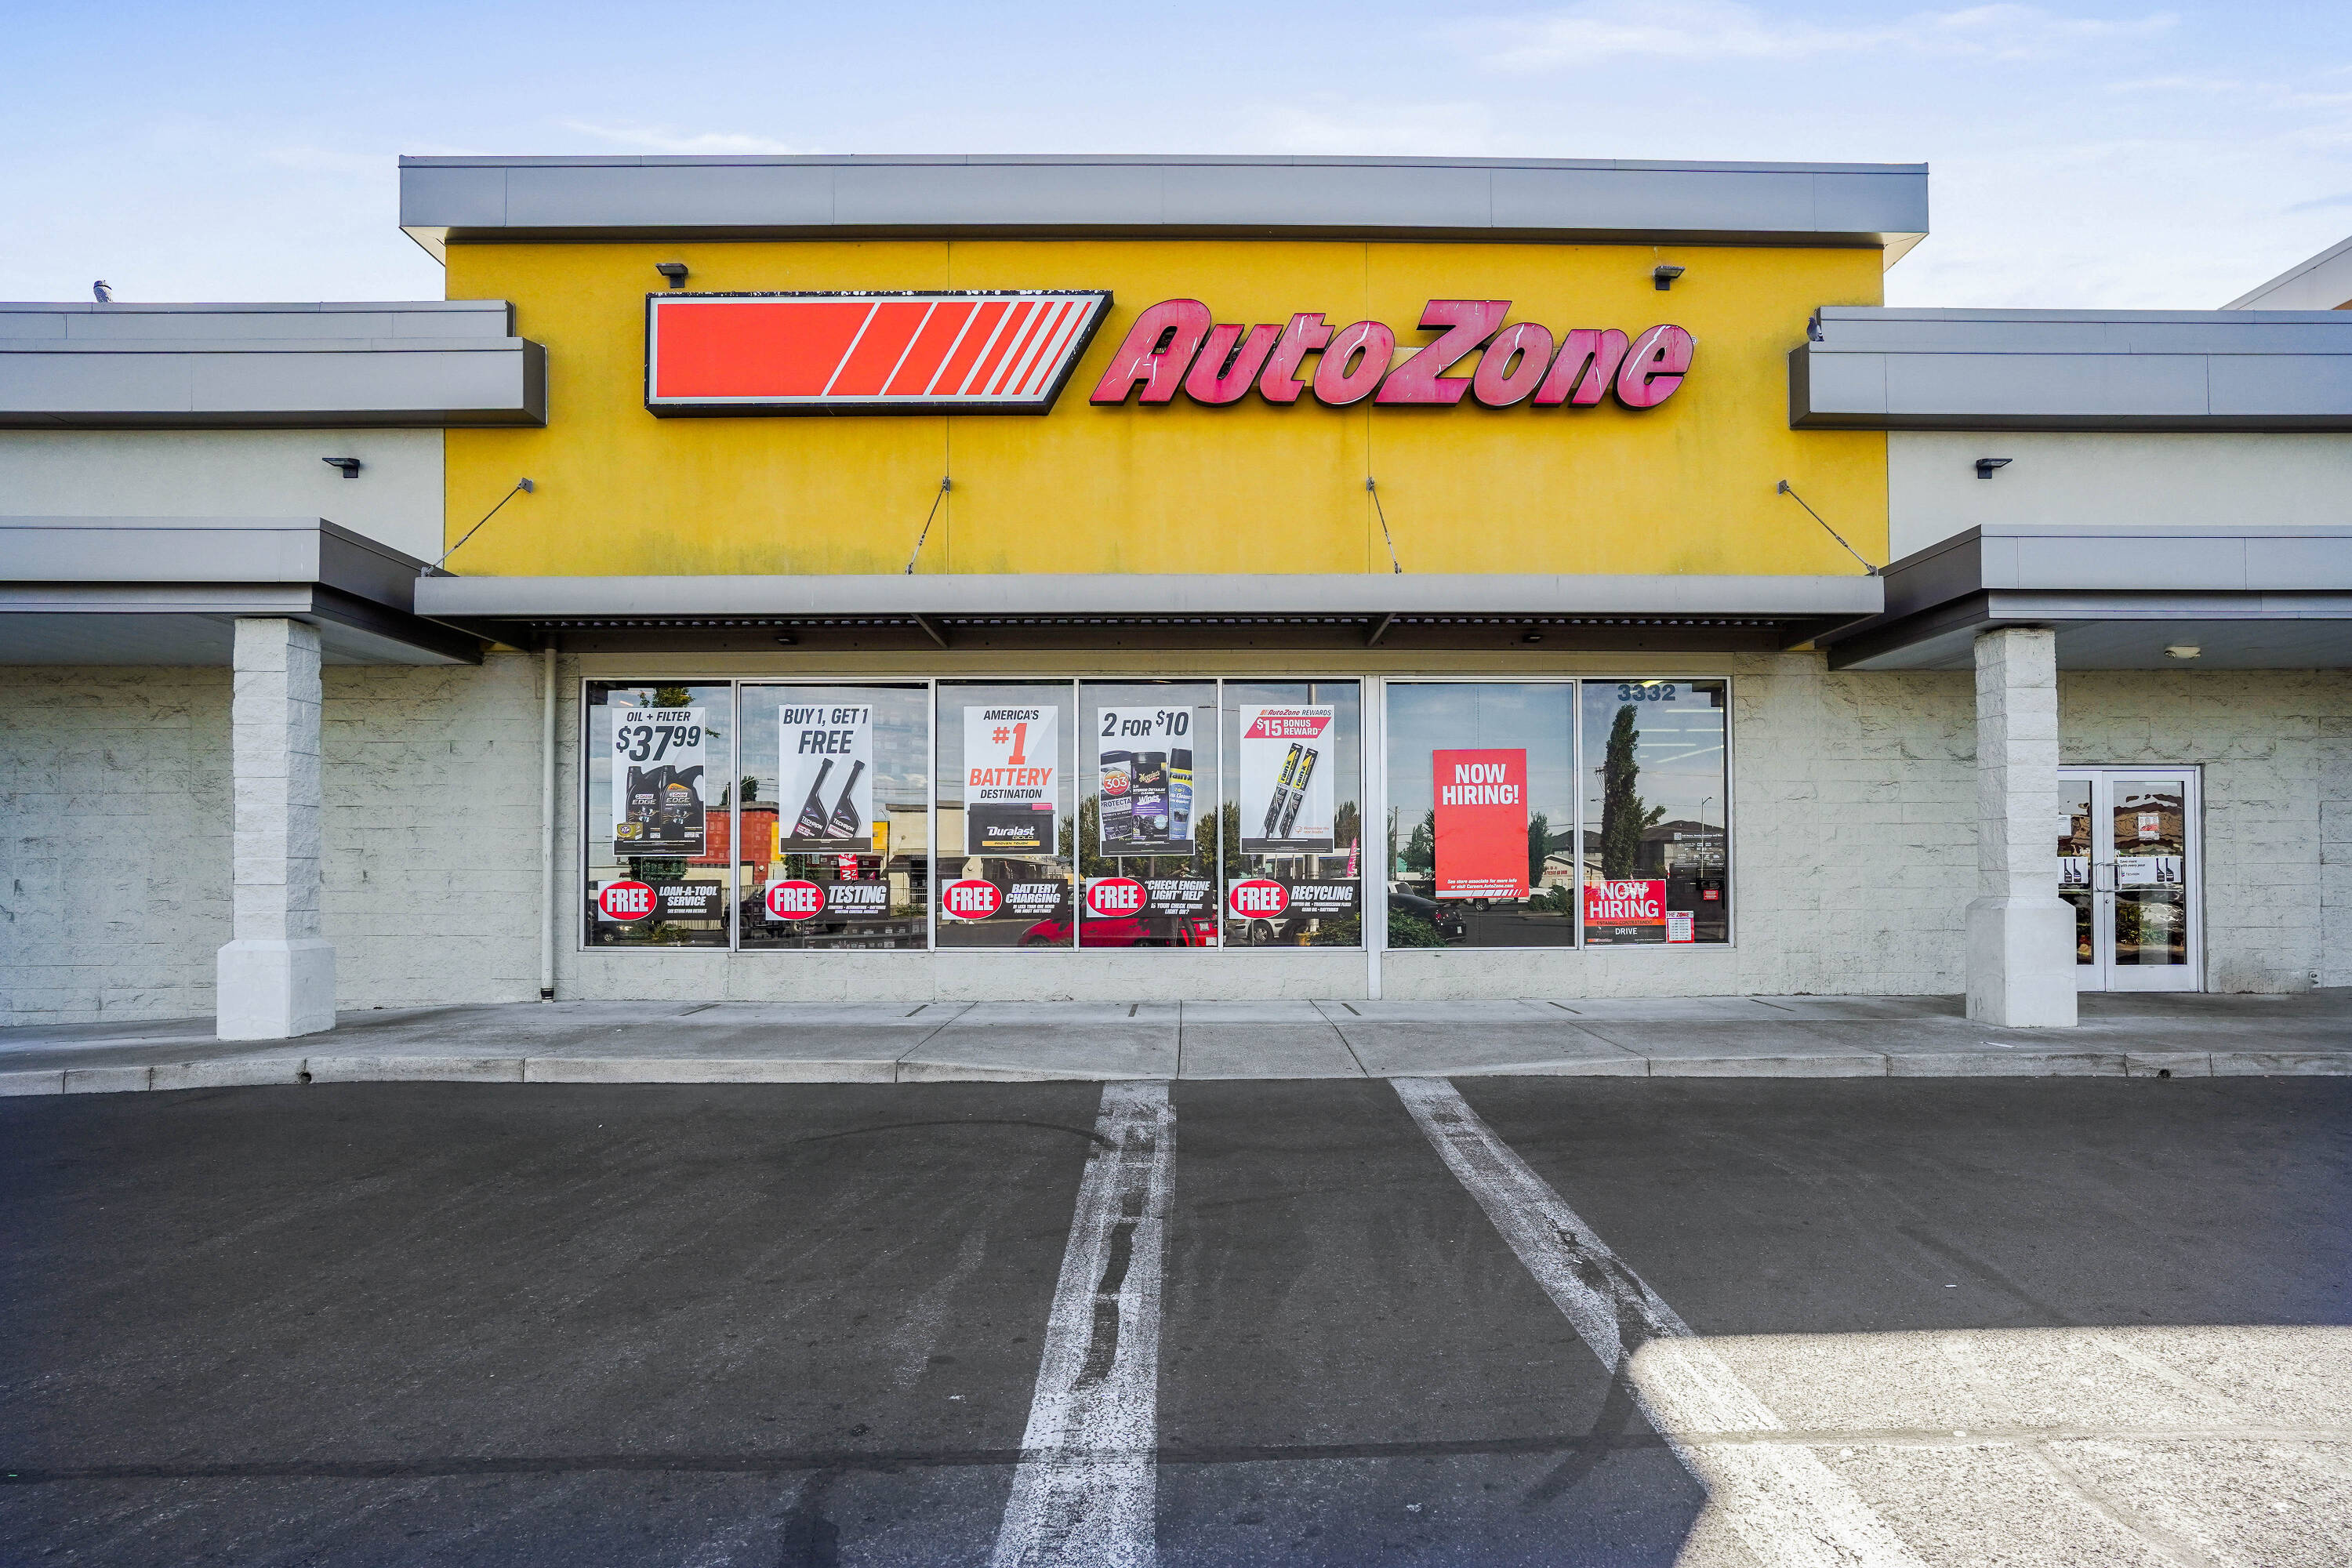
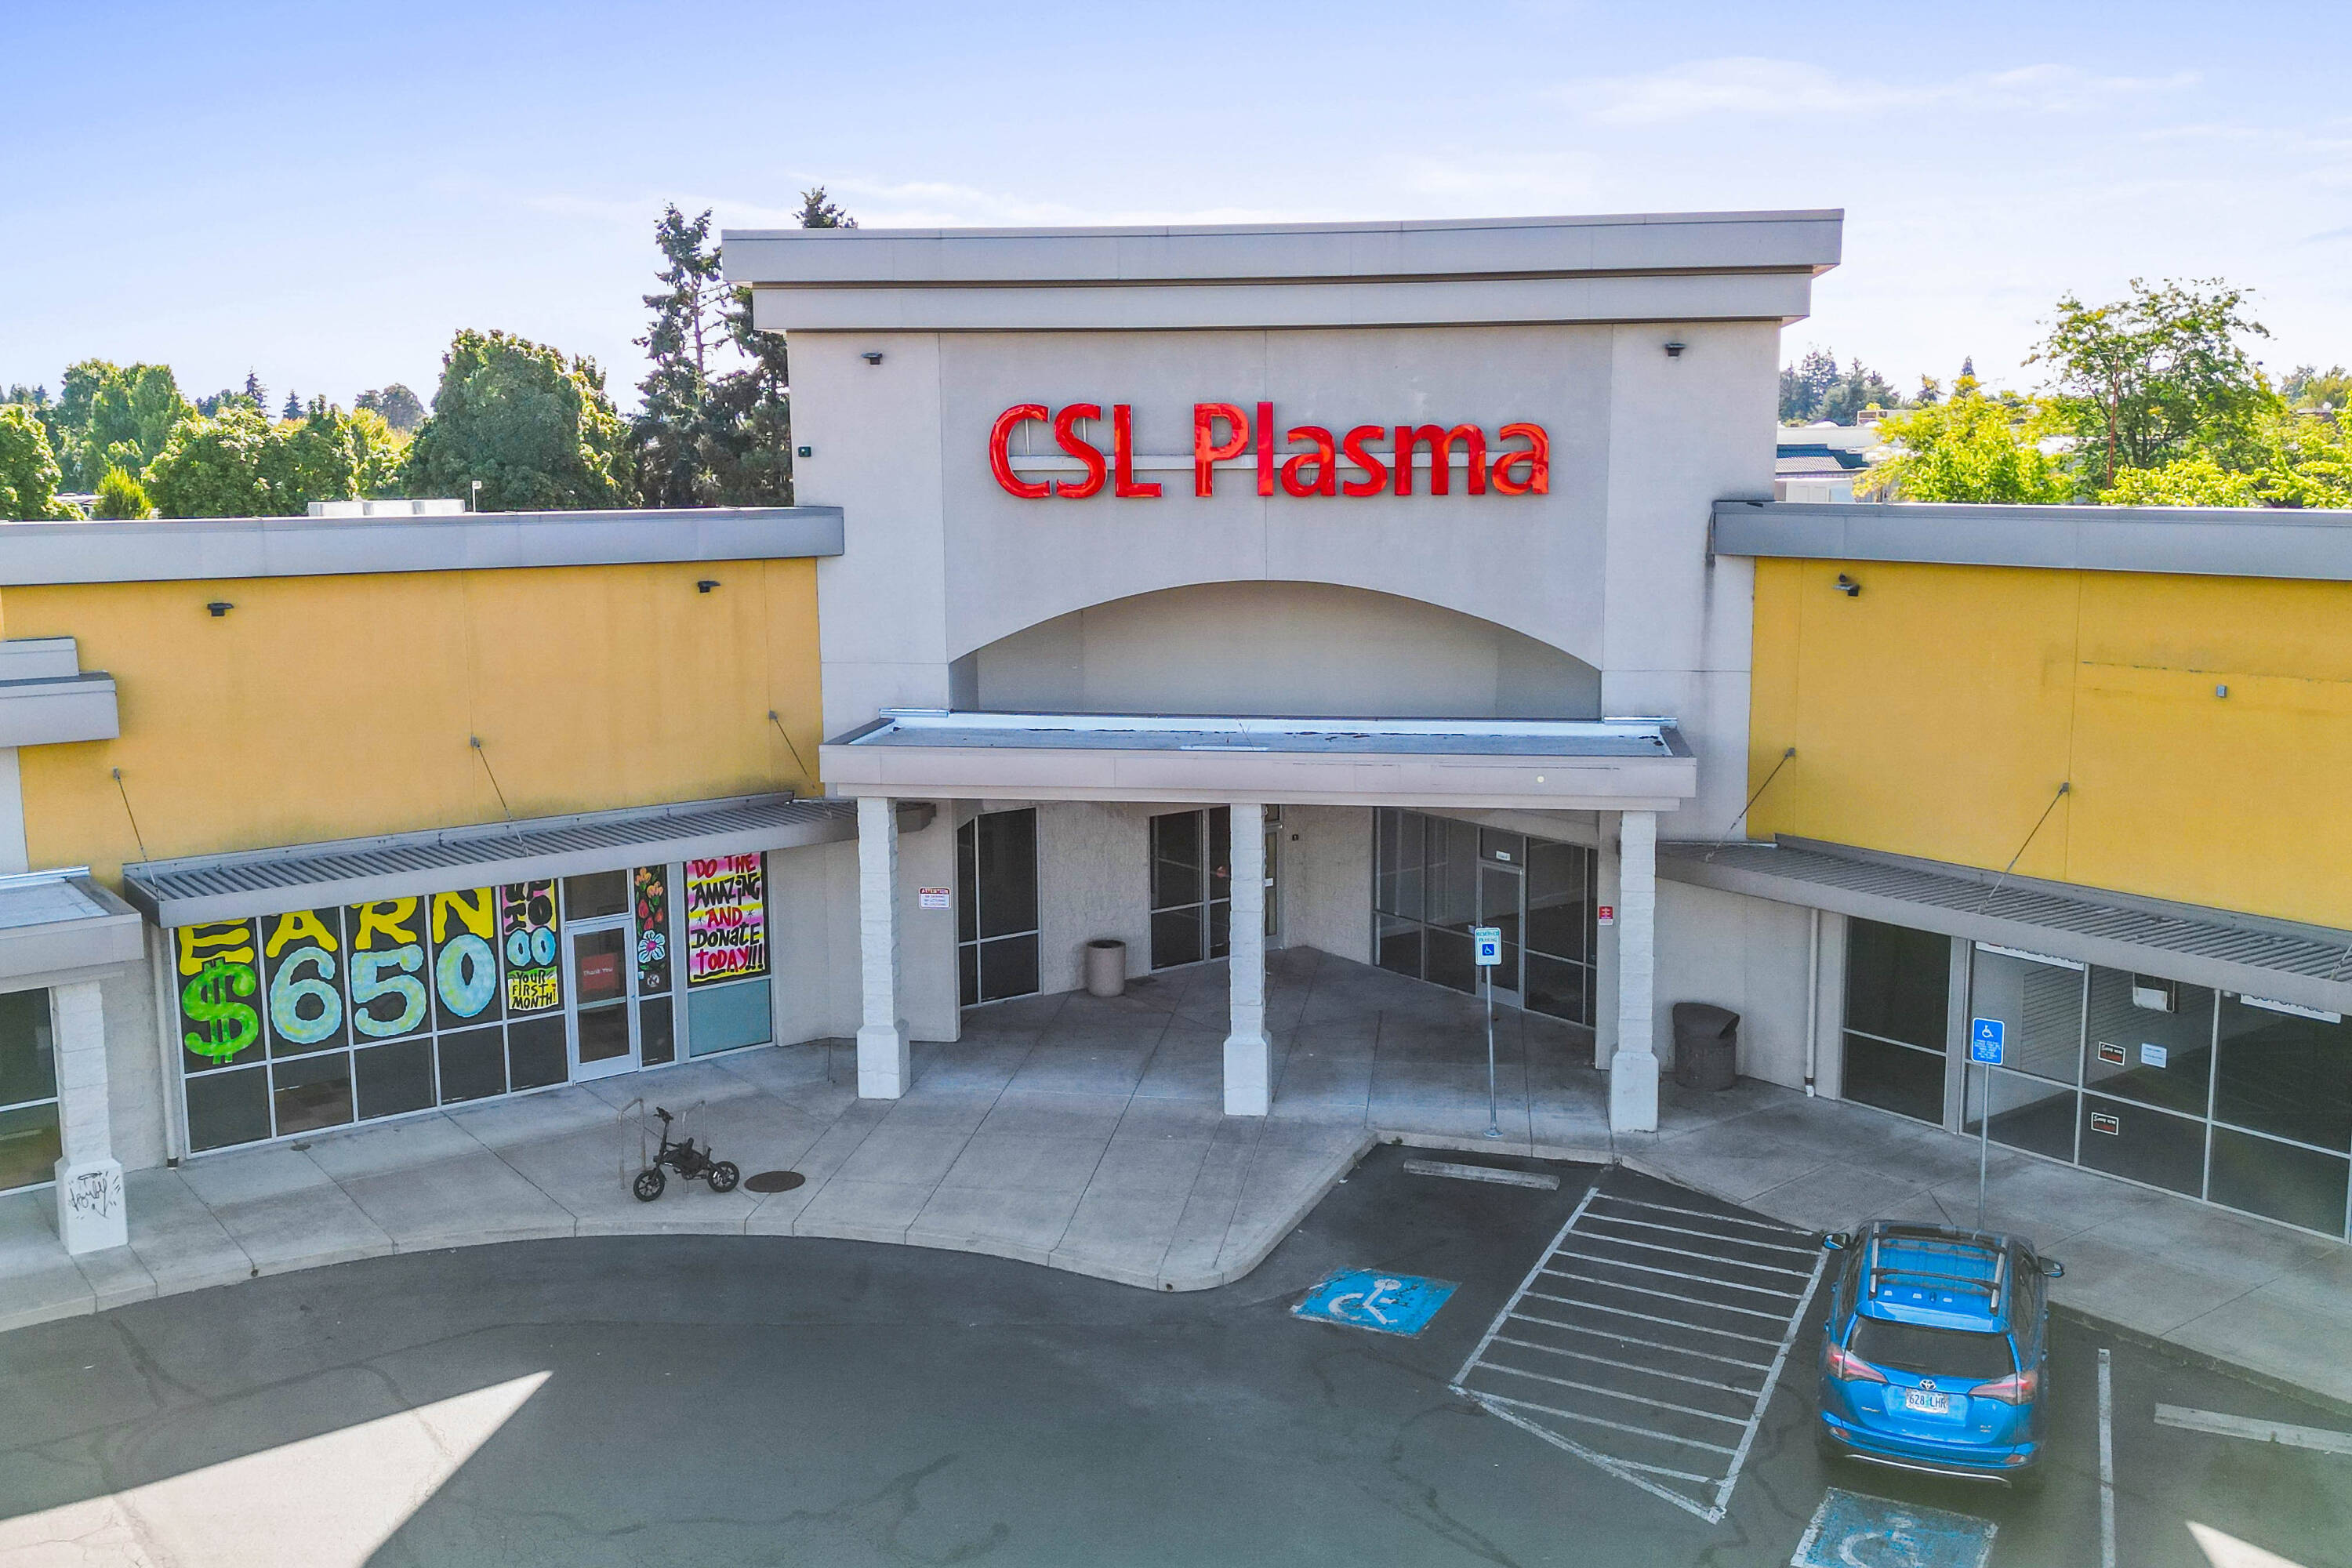
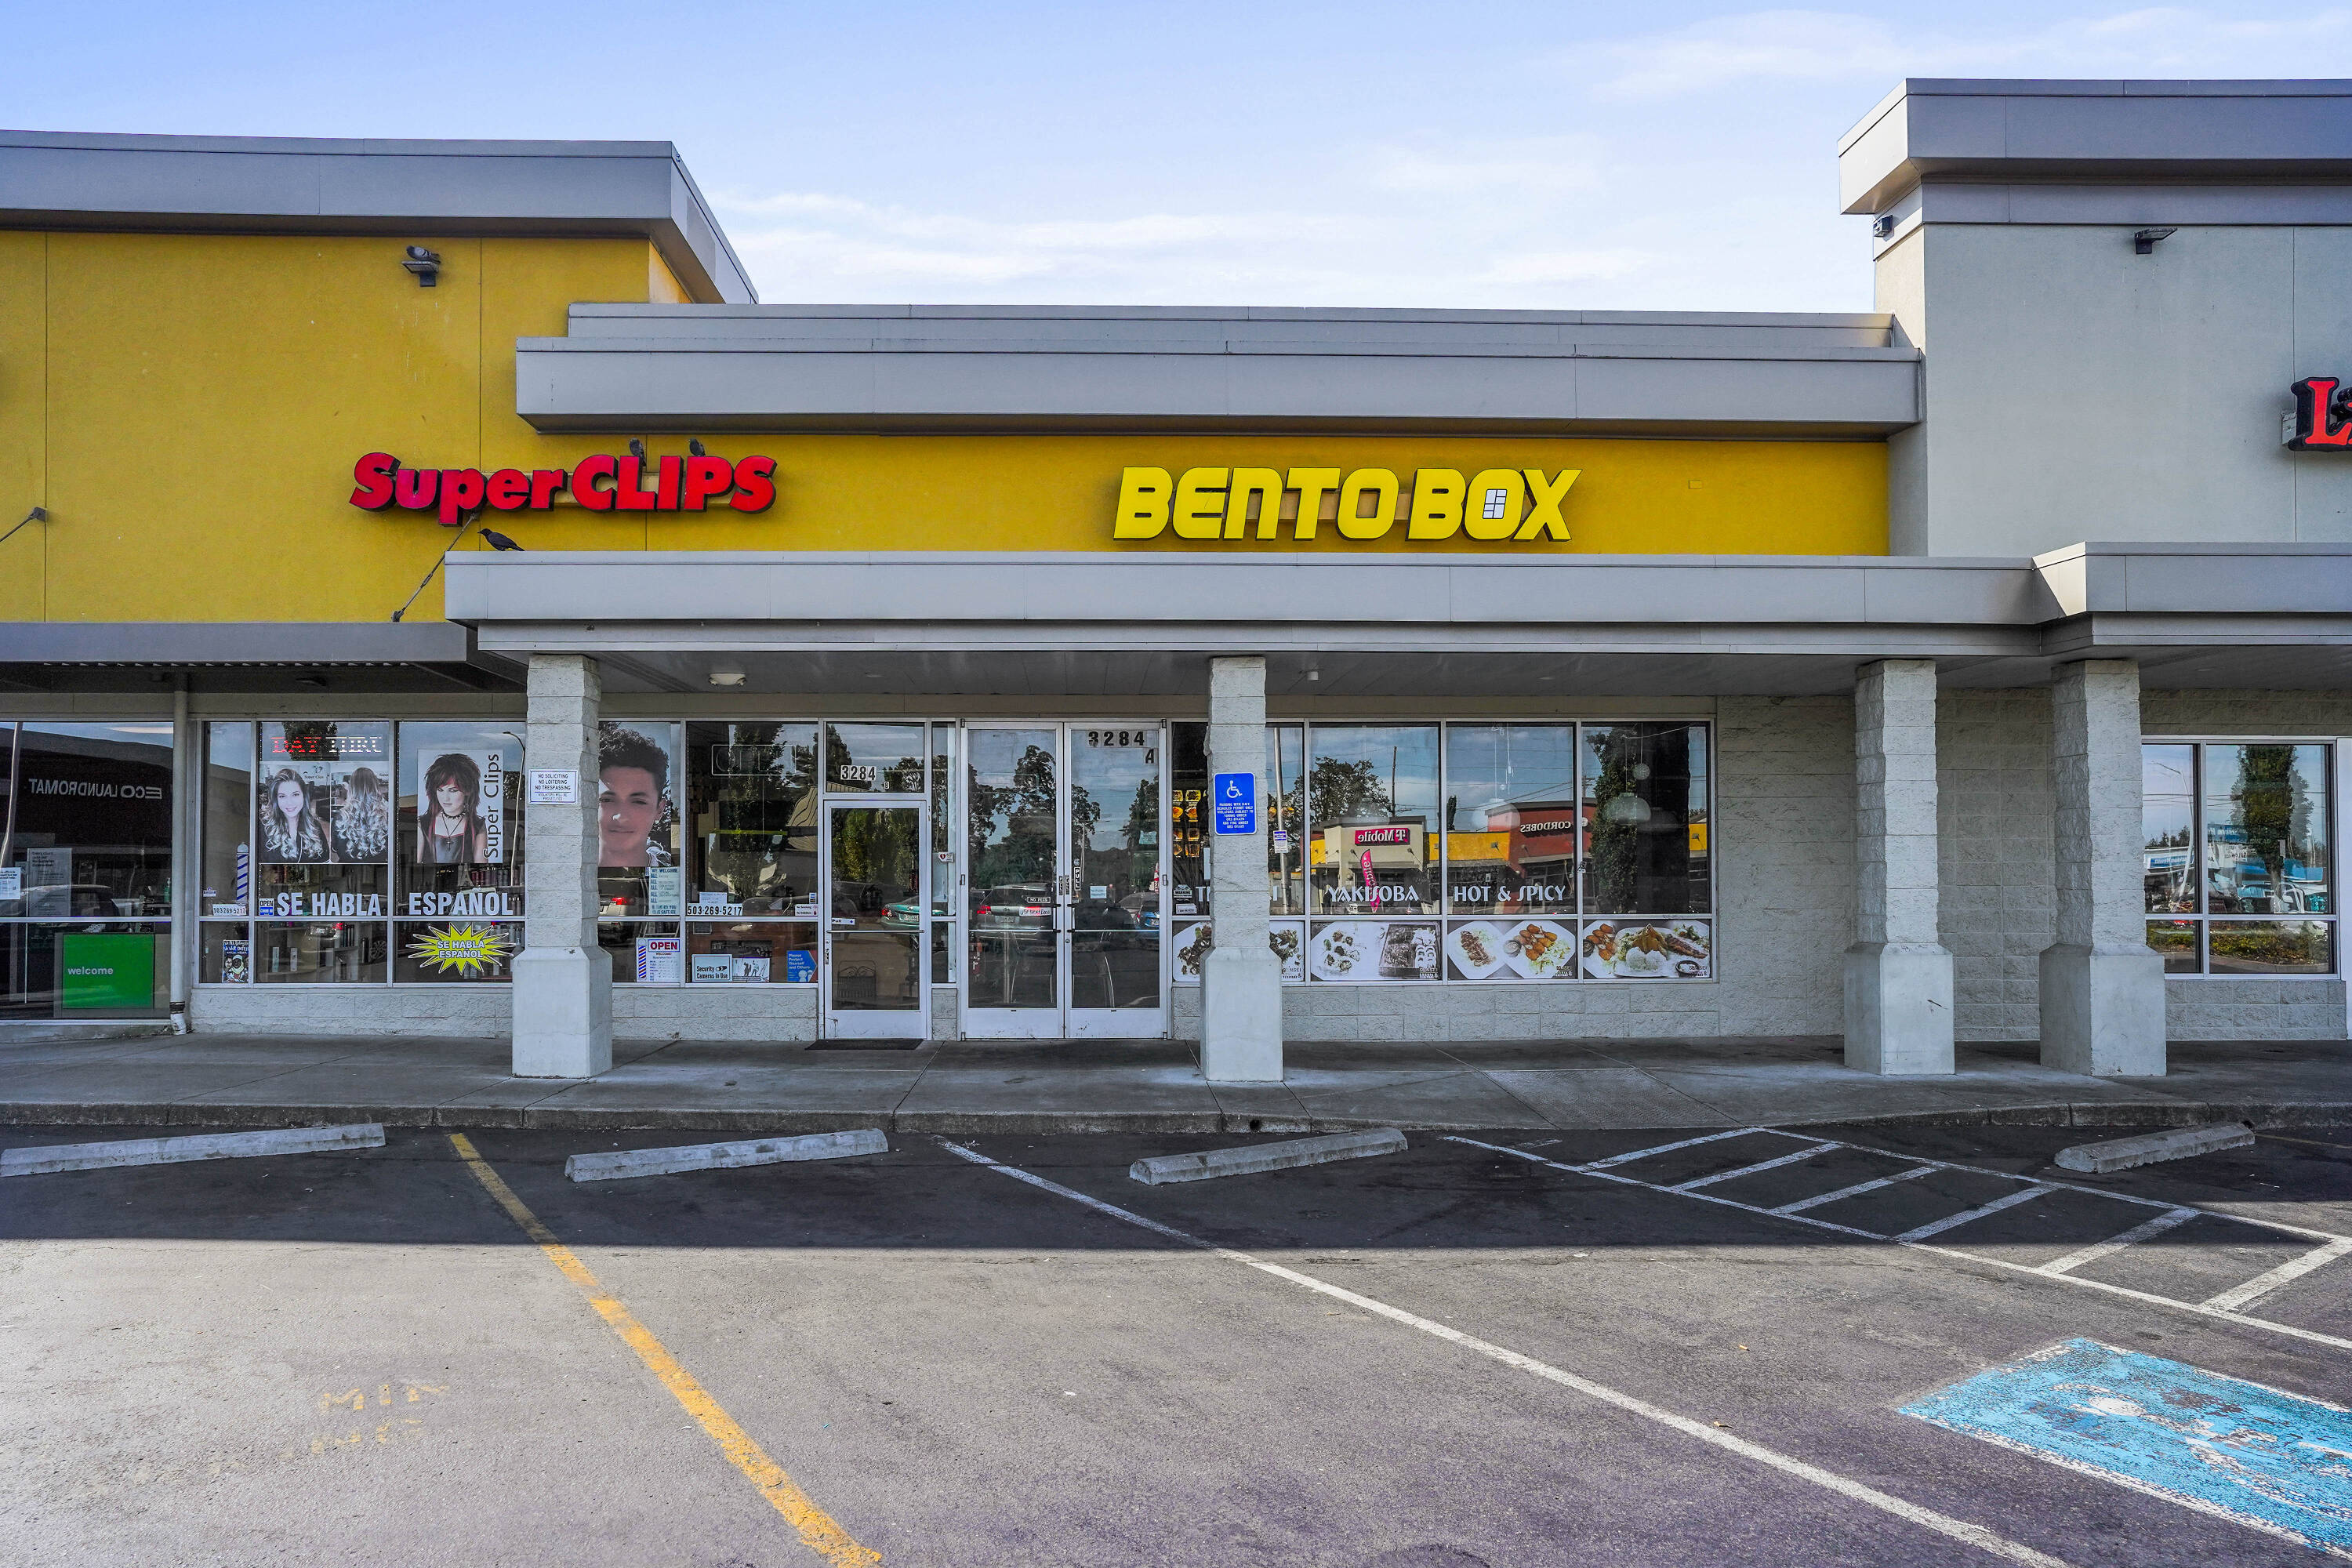
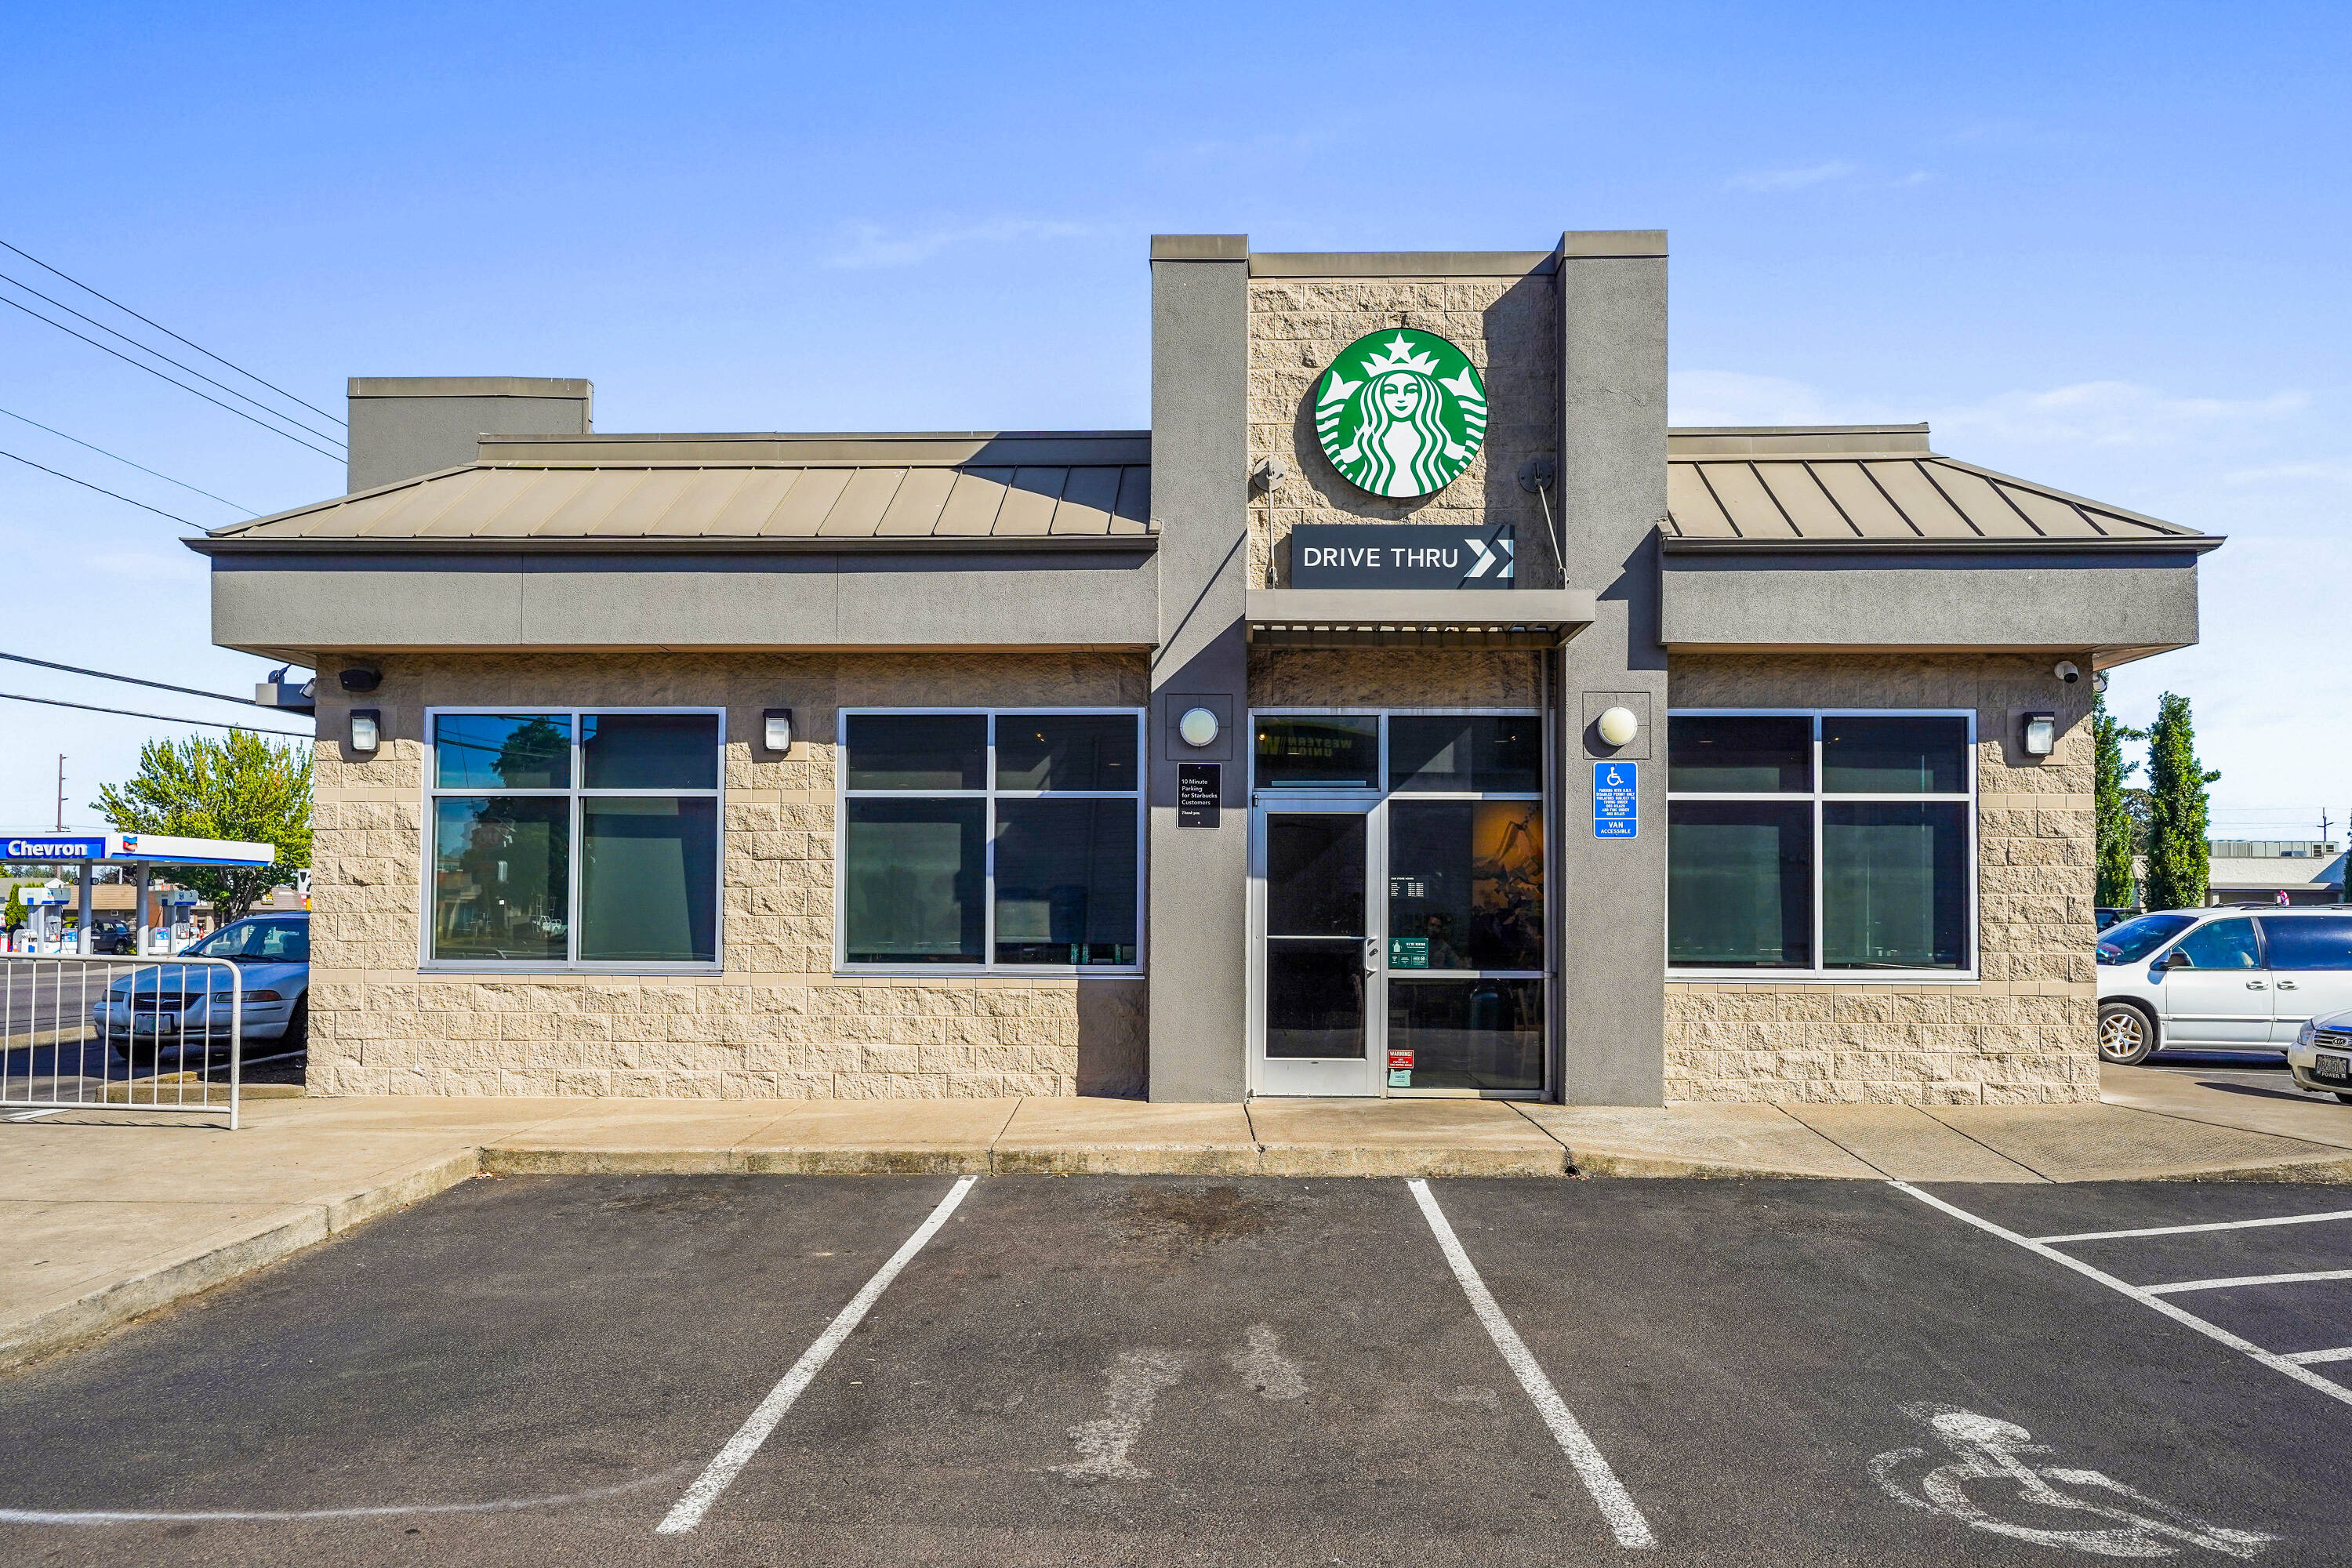
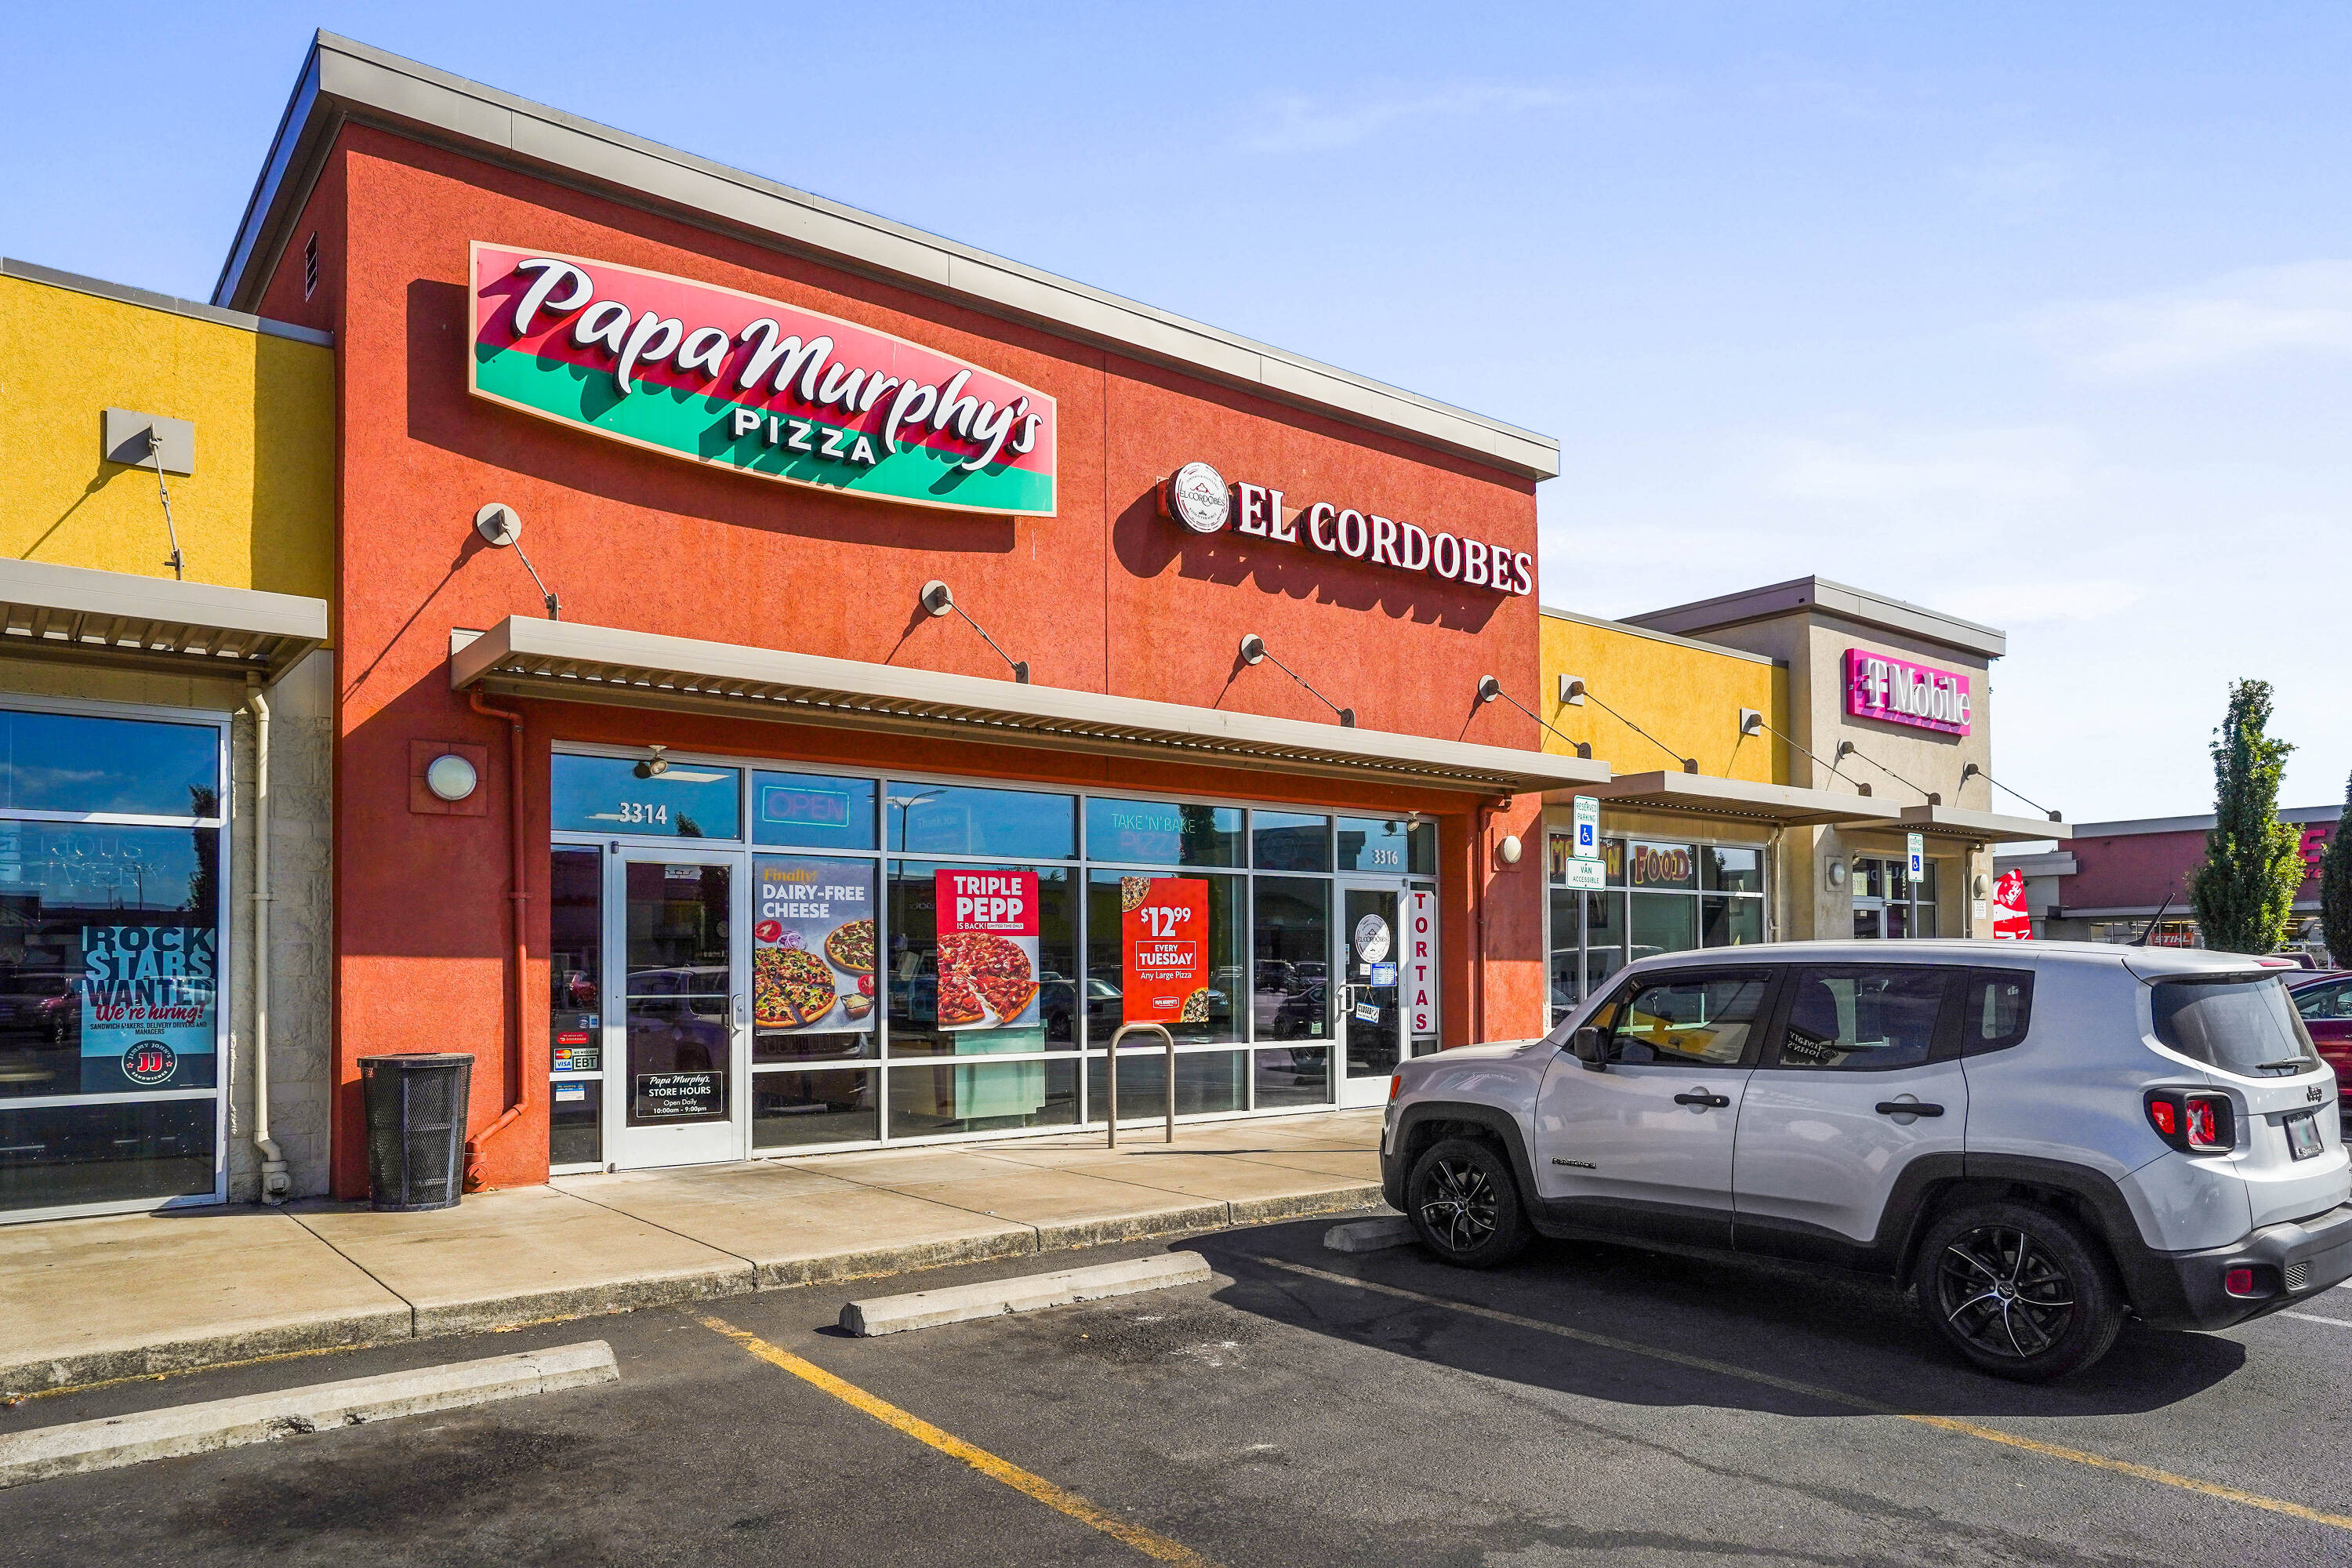
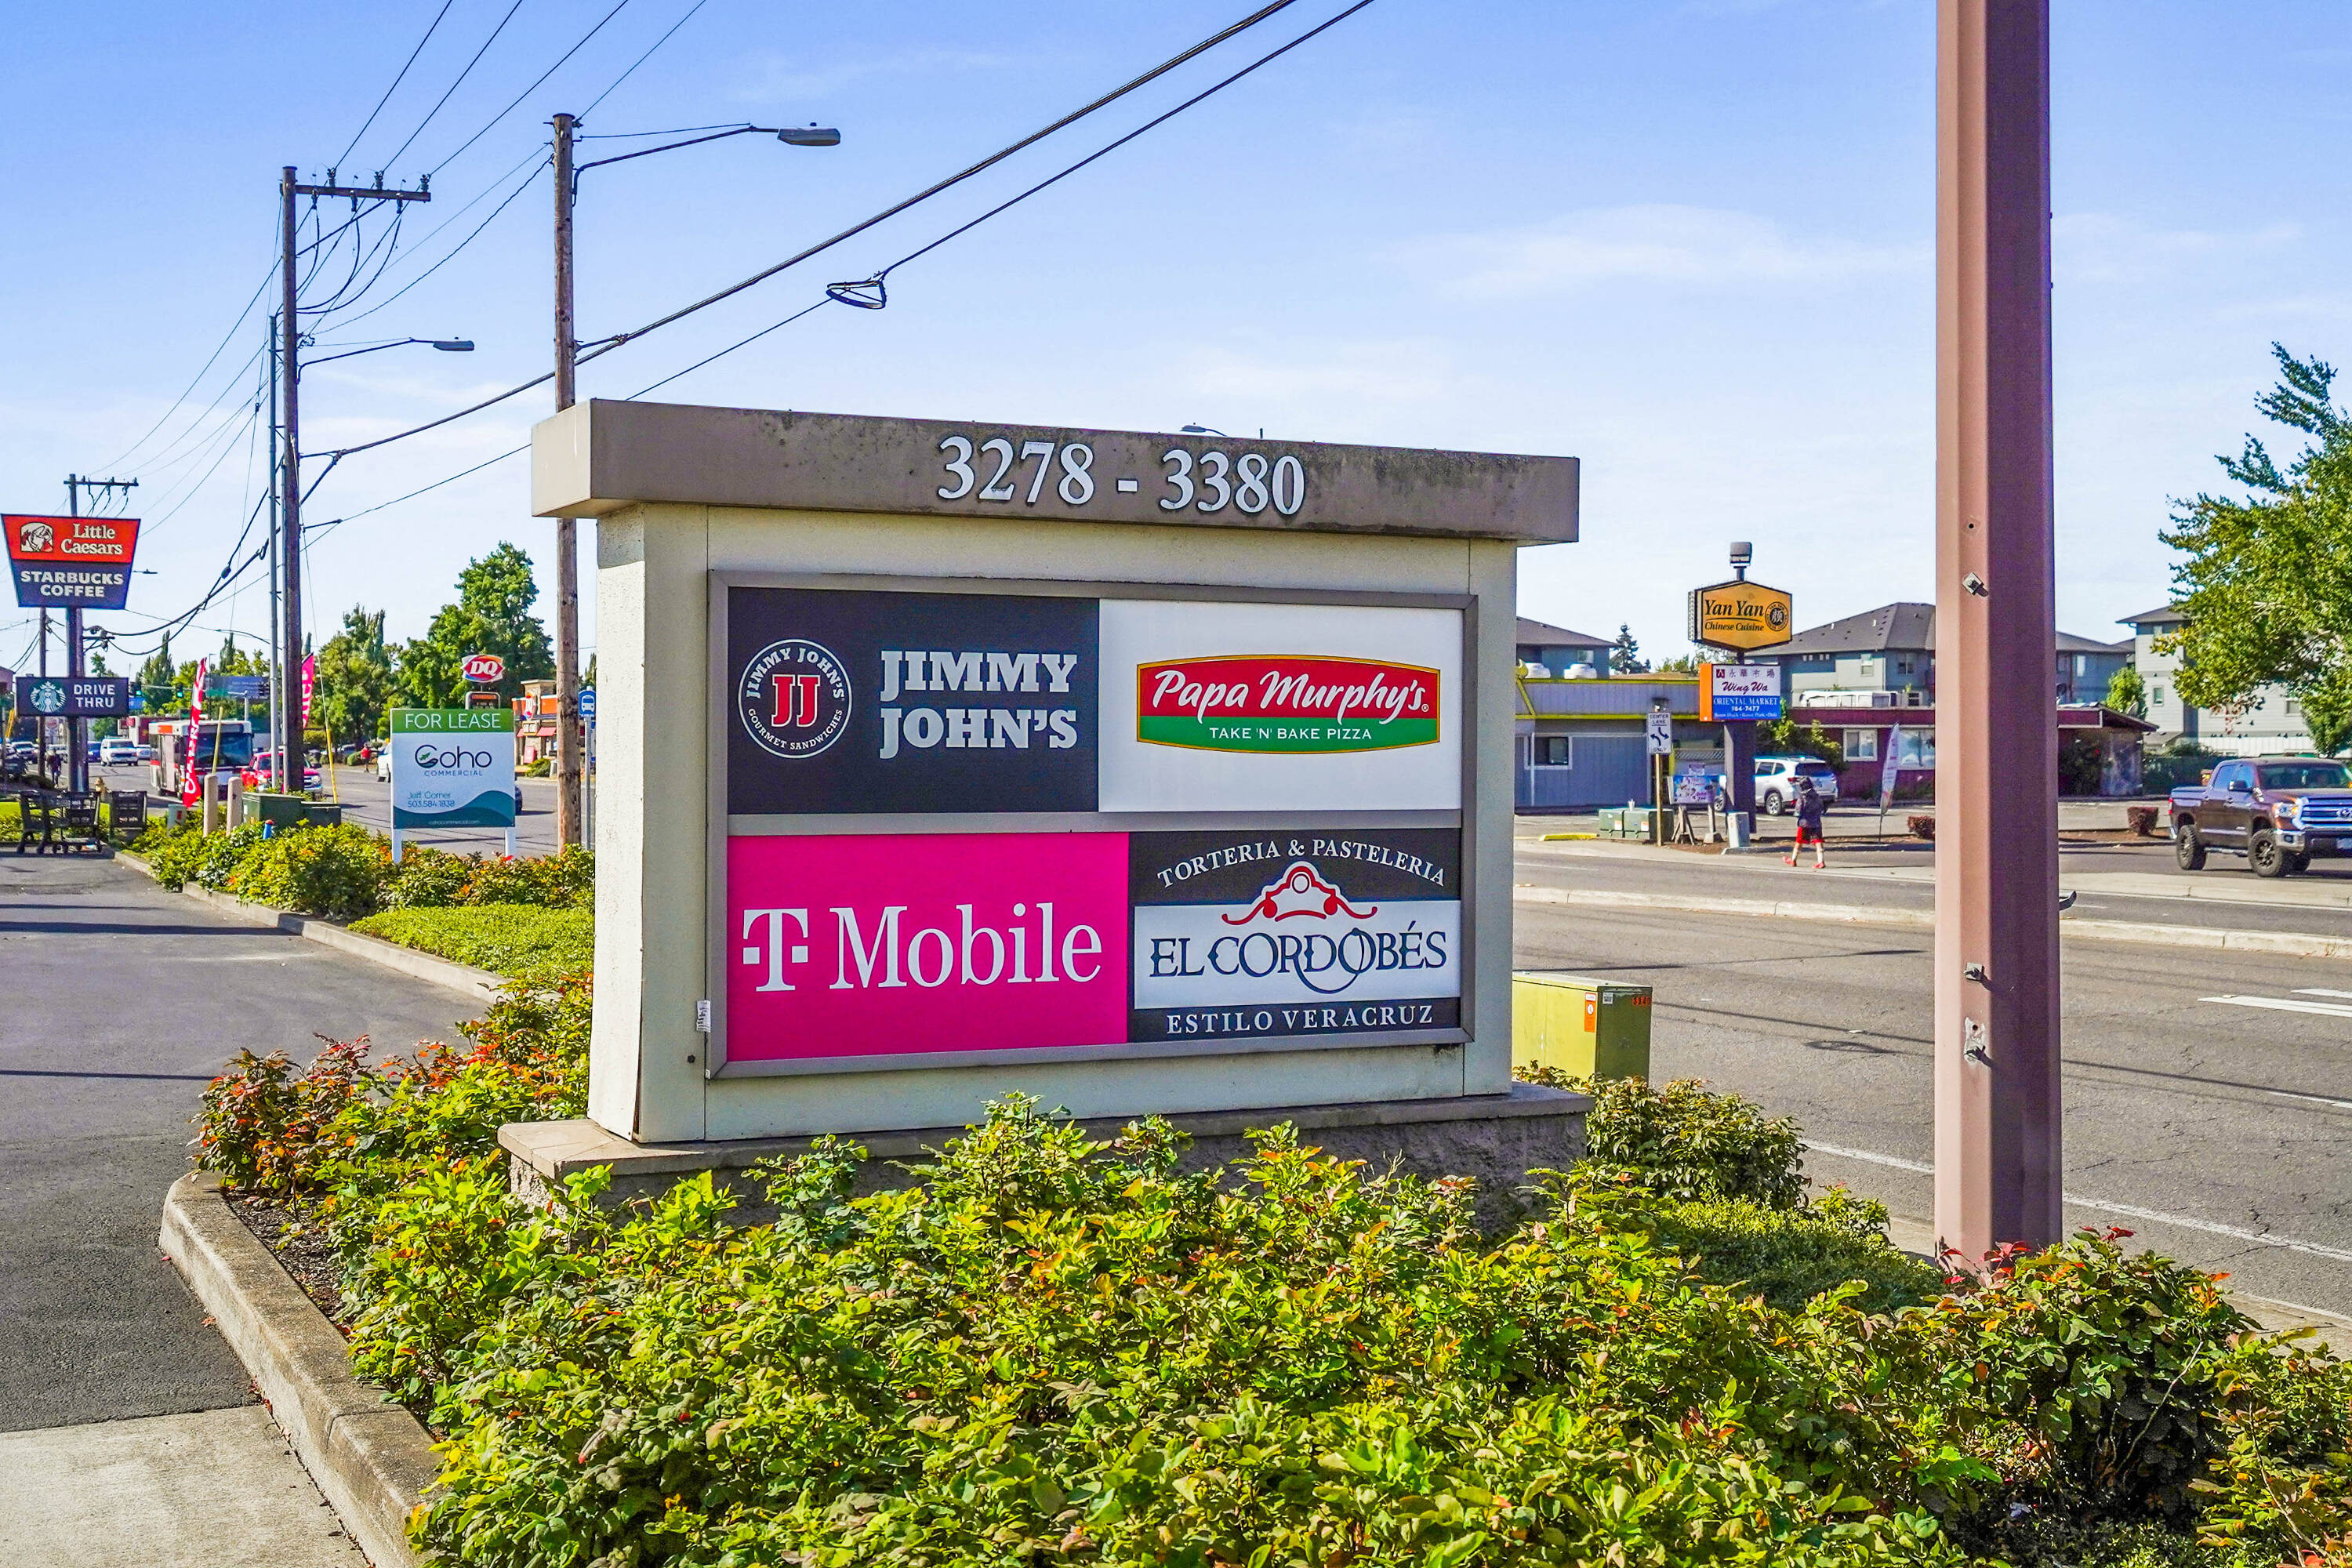
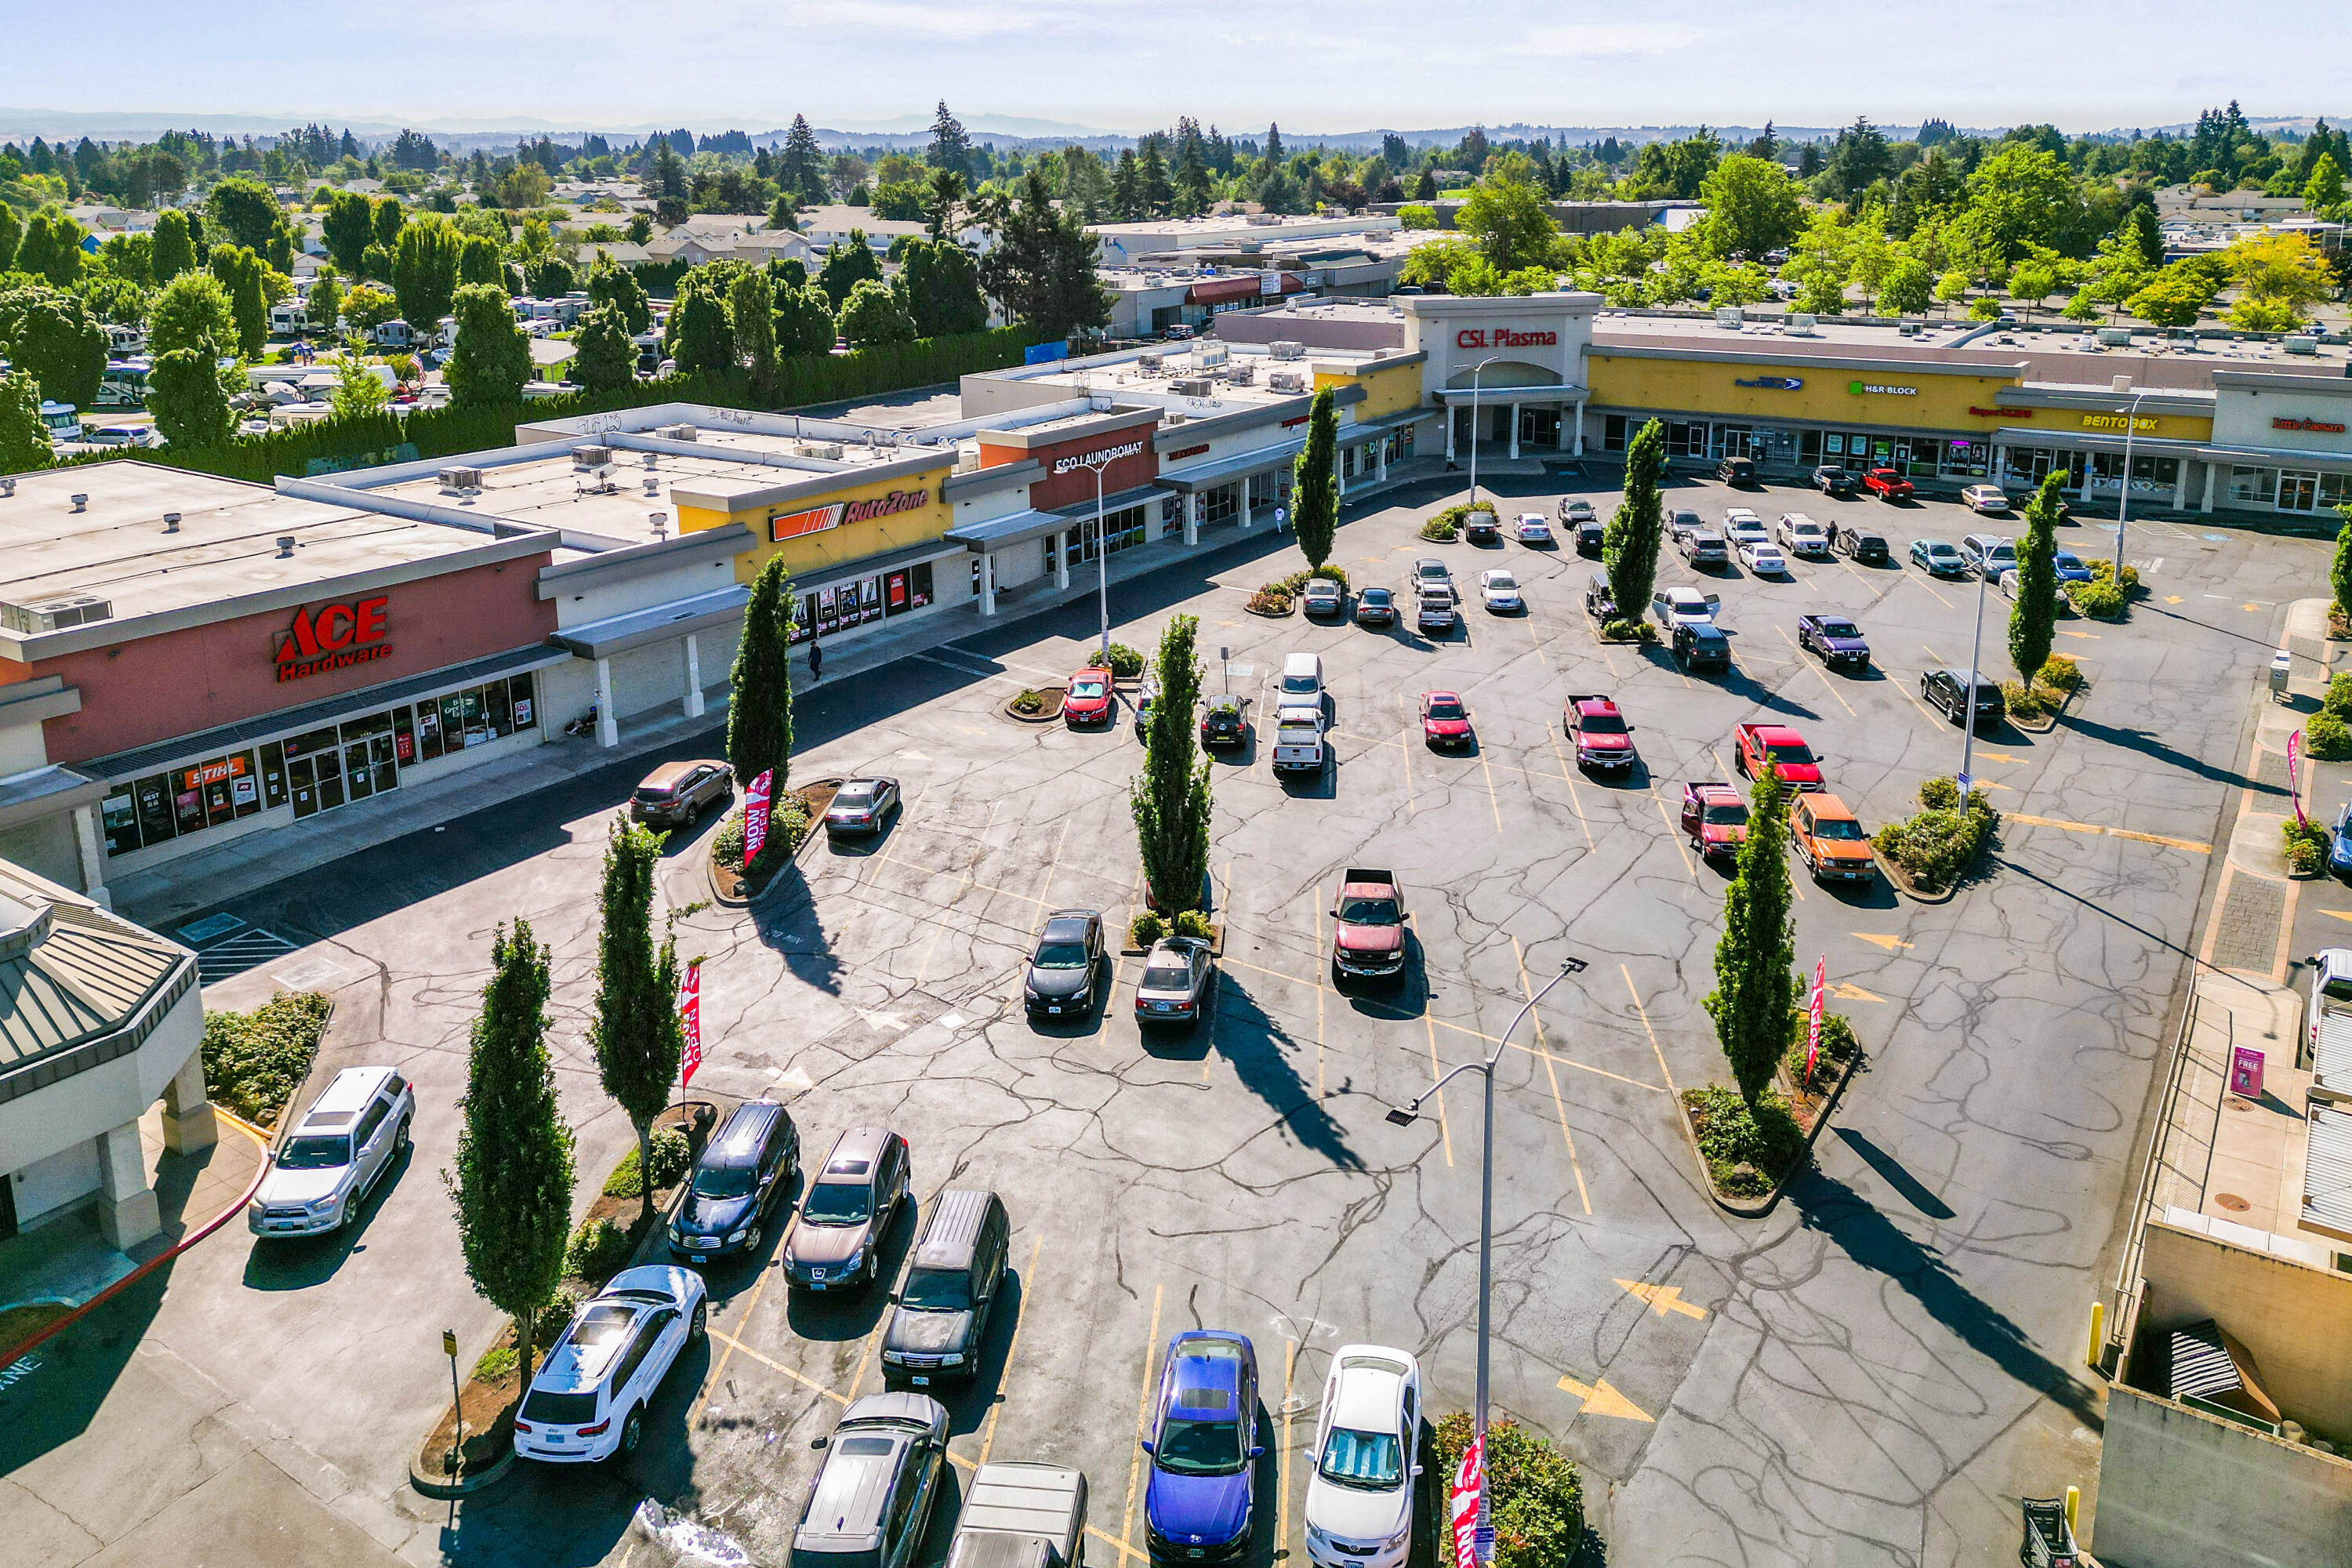
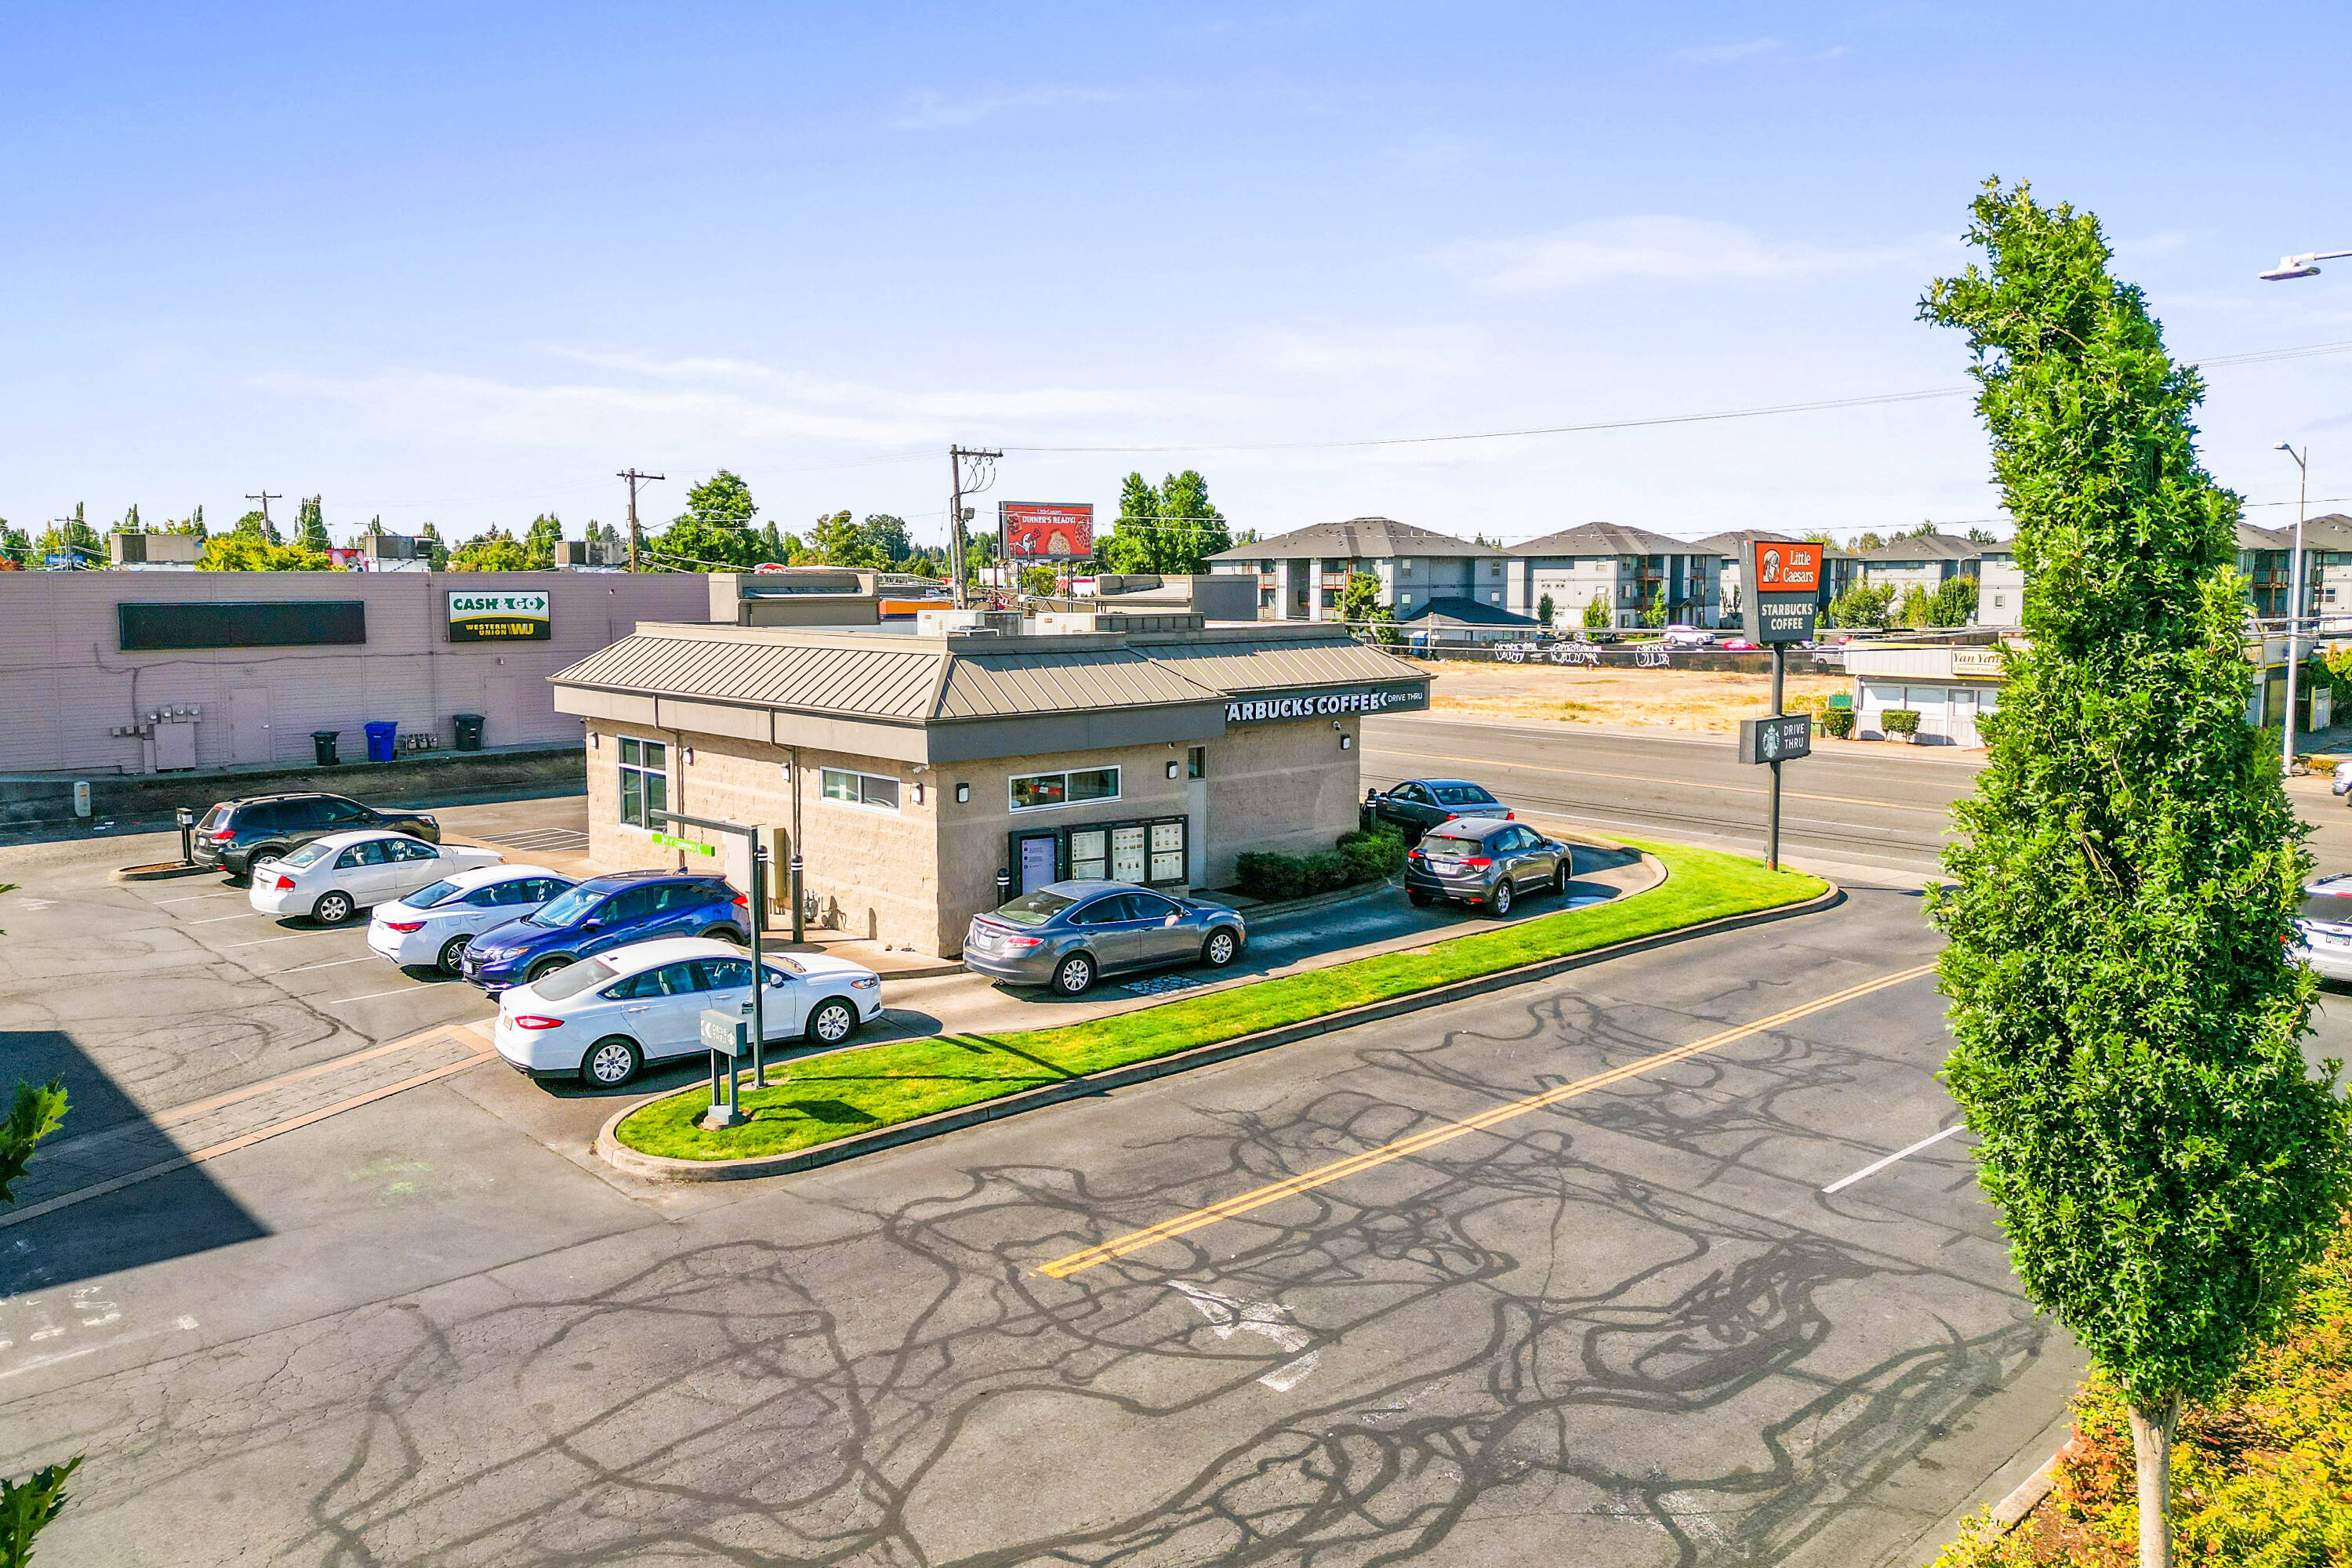
- Strong and diverse tenant mix of national and regional retailers, restaurants, and service providers.
- High‑volume retail center.
- Notable tenants include Ace Hardware, Starbucks, Autozone, and others.
Overview
Current Use by Public Records
Similar Places Nearby
- Oak Park Plaza — 3000 block of, Lancaster Dr NE, Salem, OR 97305
- TIG Tech care — 3090 lancaster dr ne, salem, or 97305
- Pioneer Place II — Brooks, OR 97305
- Coinstar Kiosk | Bitcoin ATM — Blake & Ellis, 3695 Devonshire Ave NE, Salem, OR 97305
- Coin Cloud Bitcoin ATM — 3695 Devonshire Ave NE, Salem, OR 97305
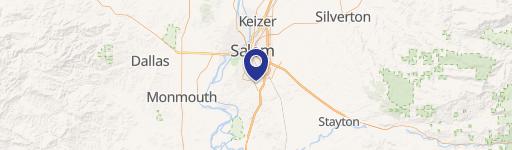
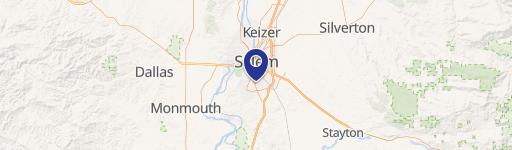
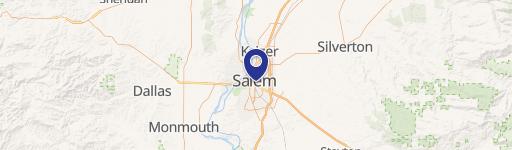
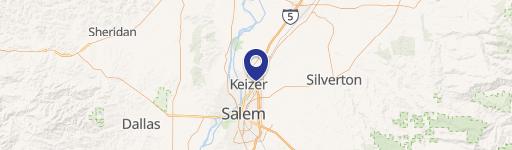
Location Insight
- Map
- Local Demand
- City
- Salem
- County
- Marion
- State
- Oregon
- Longitude
- -122.98274
- Latitude
- 44.970289