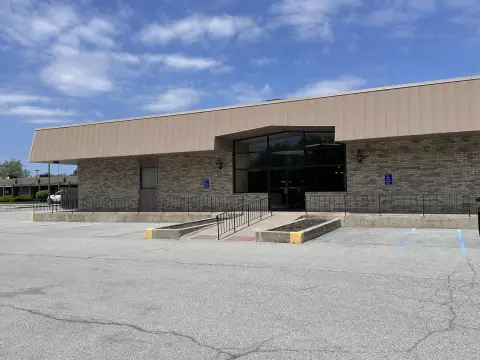
Modern Office Building with
For Sale
$3,200,000
9404 Margo Lane, Munster, IN 46321
Commercial Sale, Munster, IN
Property Size14,534 SF
Lot Size2.33 Acres
Price / SF$220.17
Days on Market274
Property Features for 9404 Margo Lane
General Information
Property type
Commercial Sale
Property subtype
Other
Zoning description
Business
Parking
64
Parking features
Garage, Off Street
Interior features
Ceiling Fan(s), Vaulted Ceiling(s), Recessed Lighting, Open Floorplan, Kitchen Island, High Ceilings, Granite Counters, Eat-in Kitchen
Exterior features
Private Yard, Storage, Rain Gutters
Accessibility
Accessible Approach with Ramp
Appliances
Built-In Gas Range, Stainless Steel Appliance(s), Range Hood, Refrigerator, Range, Microwave, Gas Range, Gas Cooktop, Dishwasher
Subdivision
Providence Bank LLC
Lot features
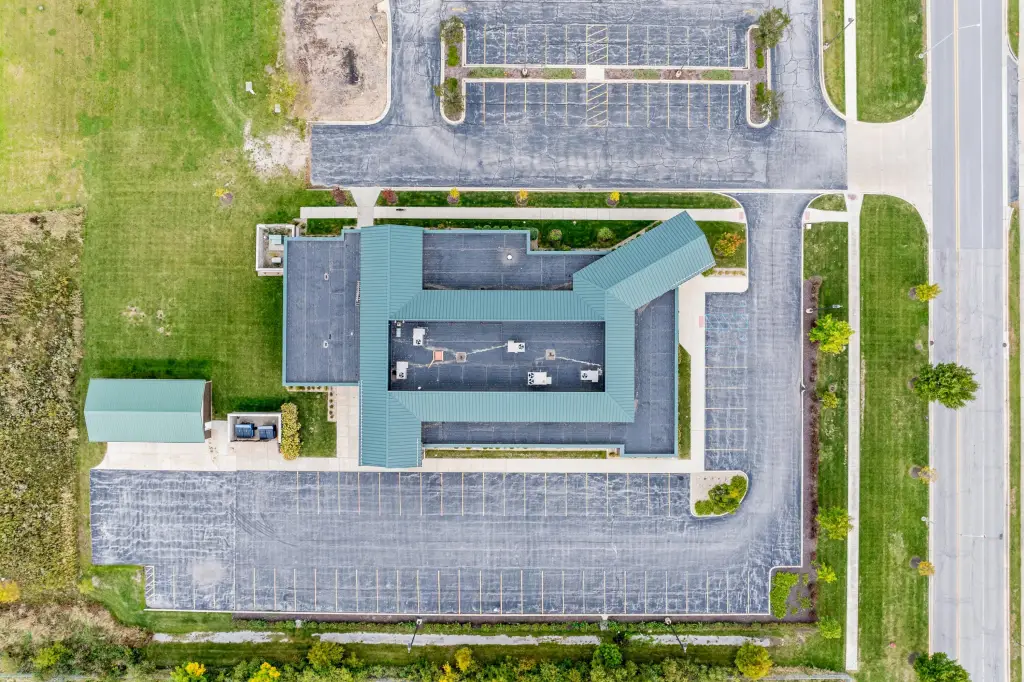
Few Trees, Paved, Landscaped
View
City
Directions
I-80/94 to Calumet Avenue, south to 45th St. West to Margo Lane, South to 9404 Margo Lane.
Standard status
Active
APN
450625300013000027
Size
14,534 SF
Lot size
2.33 Acres
Taxes and HOA fees
Tax Year
2024
Tax Description
PROVIDENCE BANK LLC (RESUB. OF LOT 2) LOT 3
Tax Annual Amount
78510
Legal Description
PROVIDENCE BANK LLC (RESUB. OF LOT 2) LOT 3
Utilities
Sewer type
Public Sewer
Heating system
Forced Air, Natural Gas
Water source
Public
Amenities
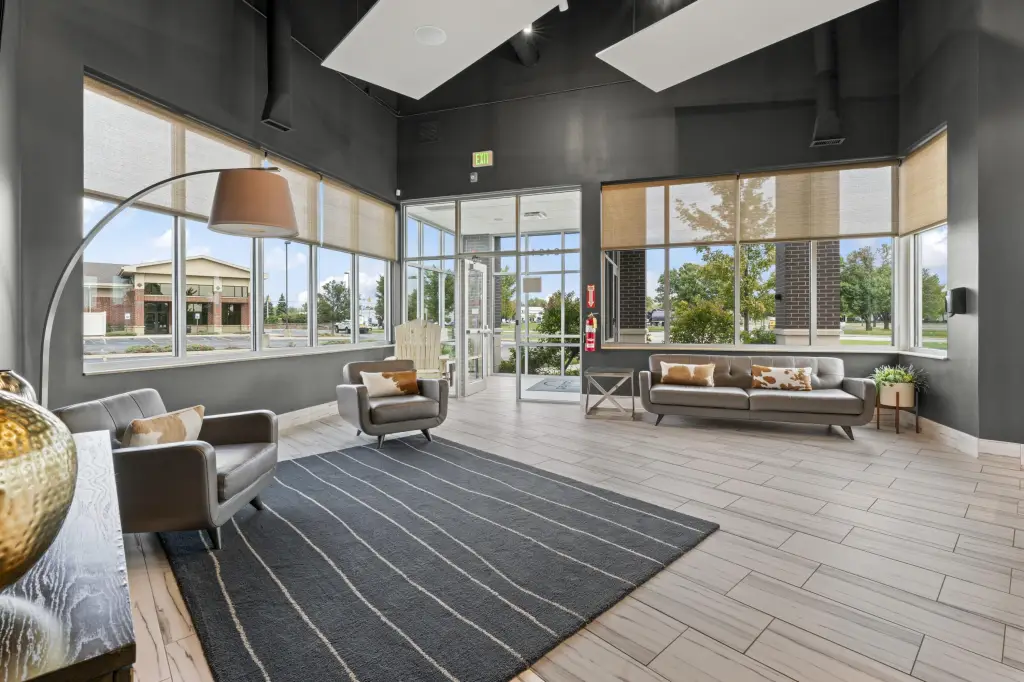
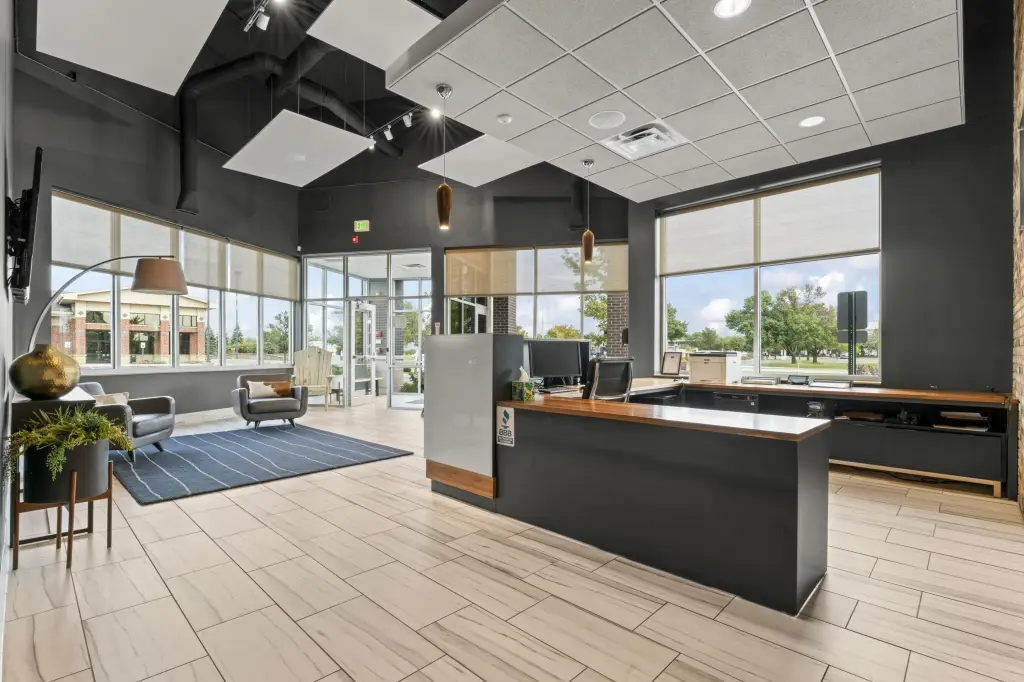
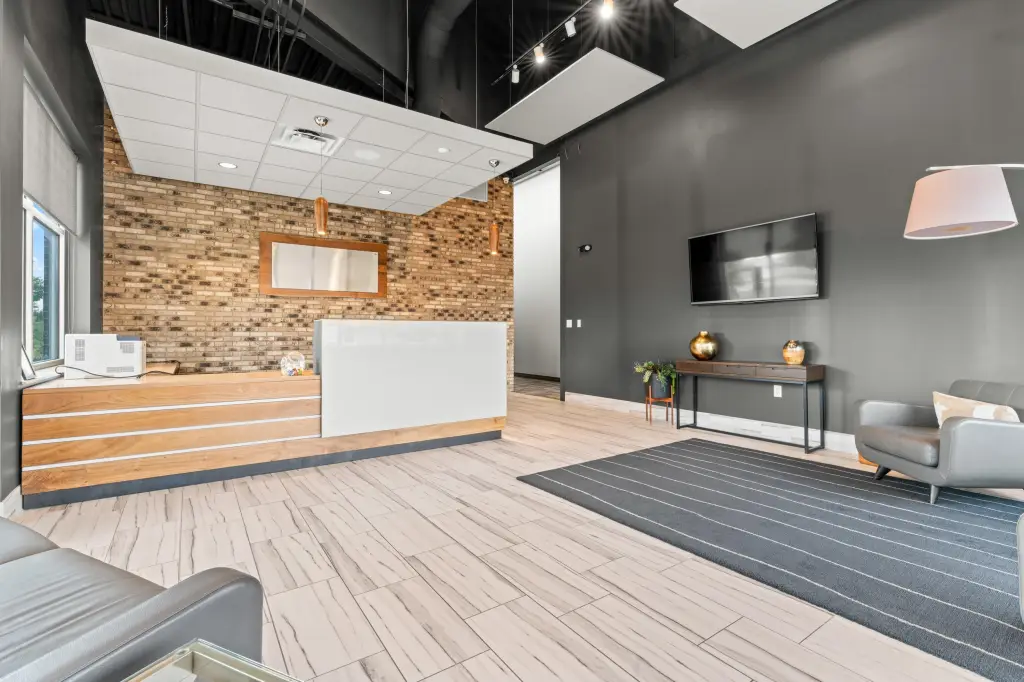
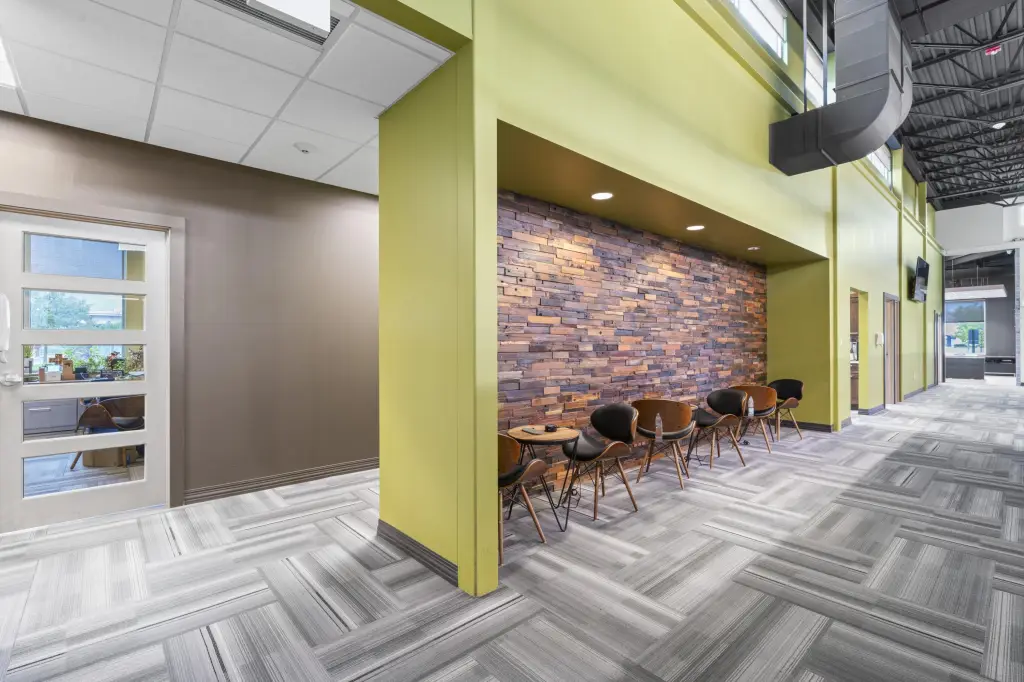
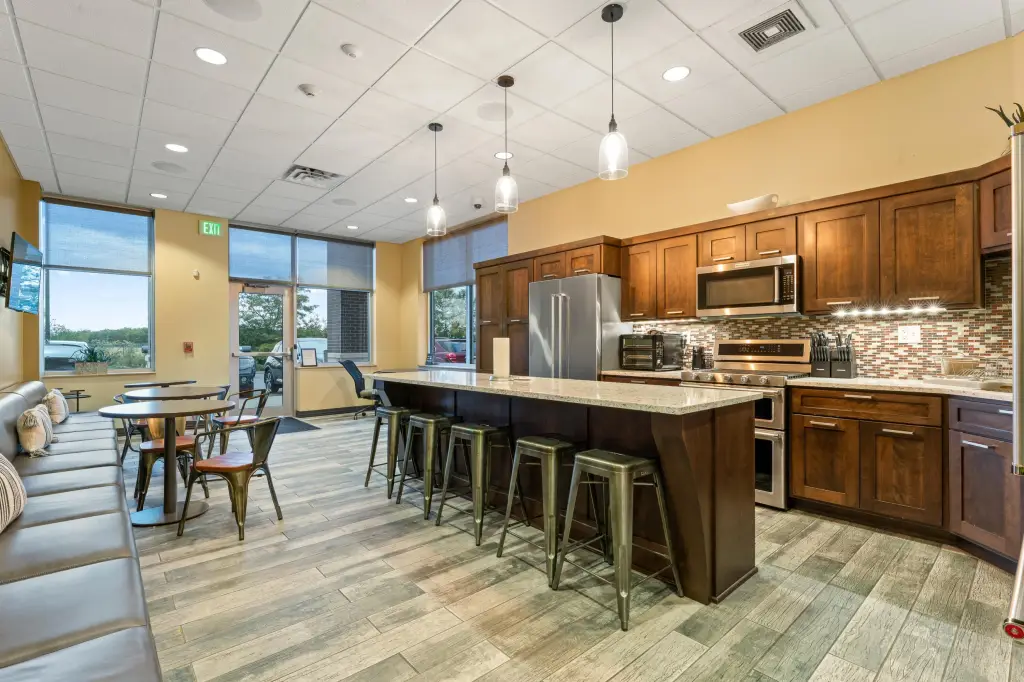
reception area
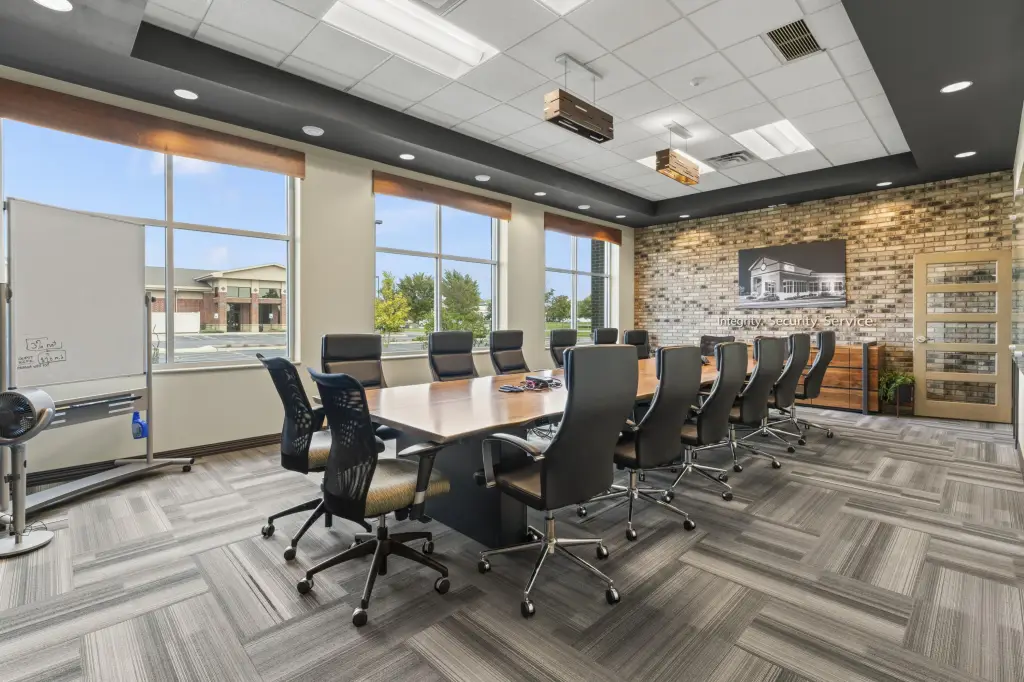
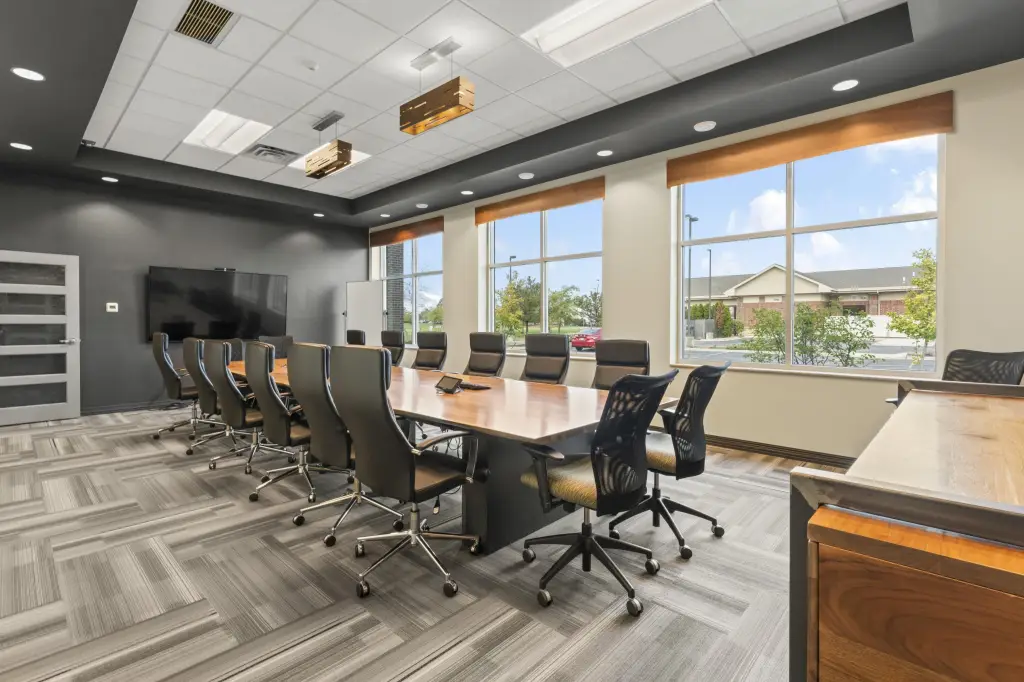
conference room
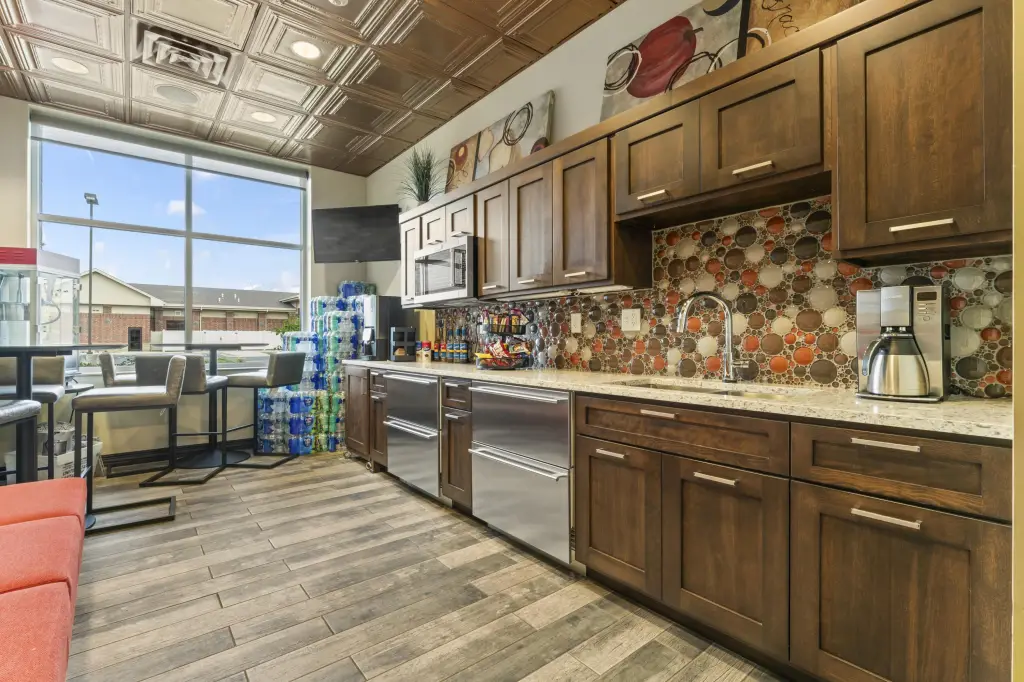
break area
sitting areas with charging stations
copy room
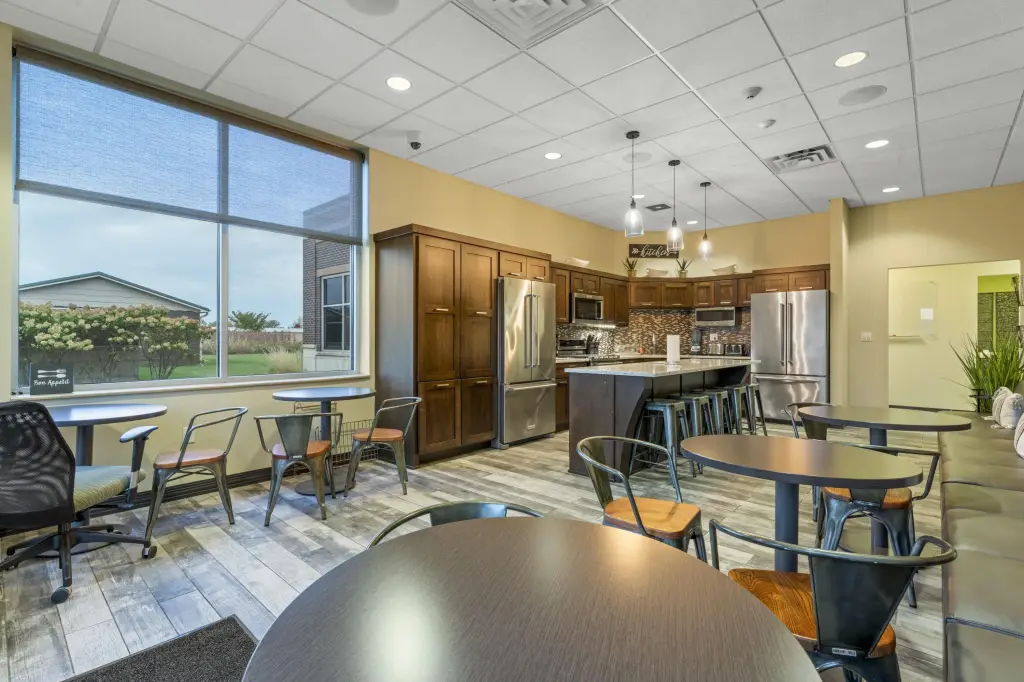
employee break room with full kitchen
Building Details
Year built
2017
Additional Structures
Storage
Listing Agency:
Realty Executives Premier · Realty Executives International
(219) 462-2224
Listed By:
William Kornblum · License #475167449
(219) 308-9629
Added: Jan 12
Changed: Sep 24
Last Checked: Oct 13 at 1:06AM
MLS# 832724
Copyright © 2026 Greater Northwest Indiana Association of REALTORS. All rights reserved. All information provided by the listing agent/broker is deemed reliable but is not guaranteed and should be independently verified.
Investment Insights
Based on property information with market context.
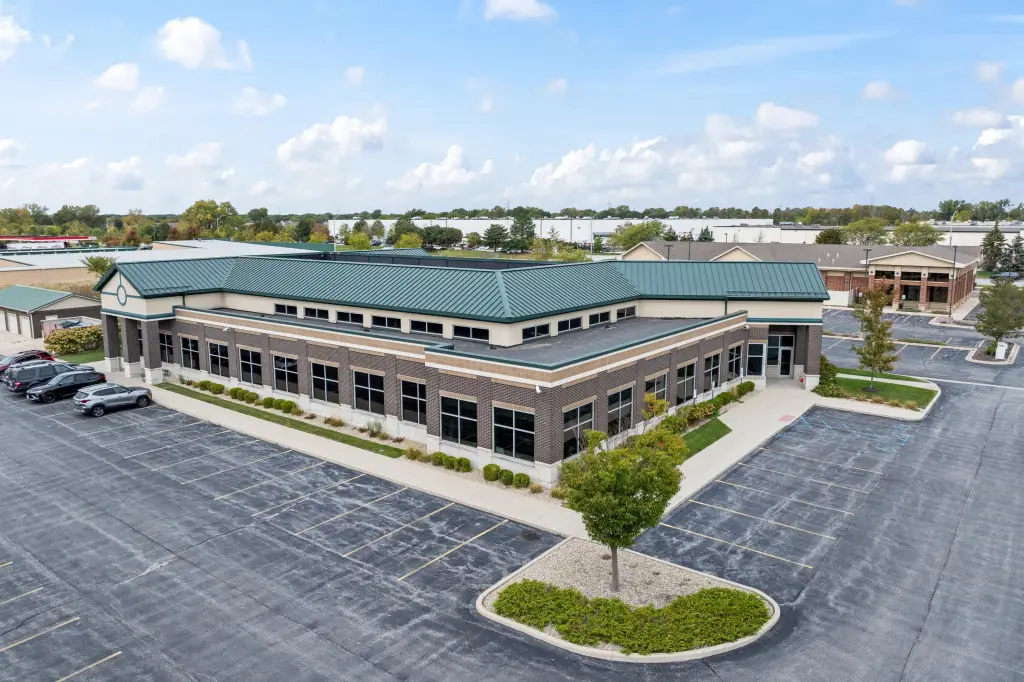
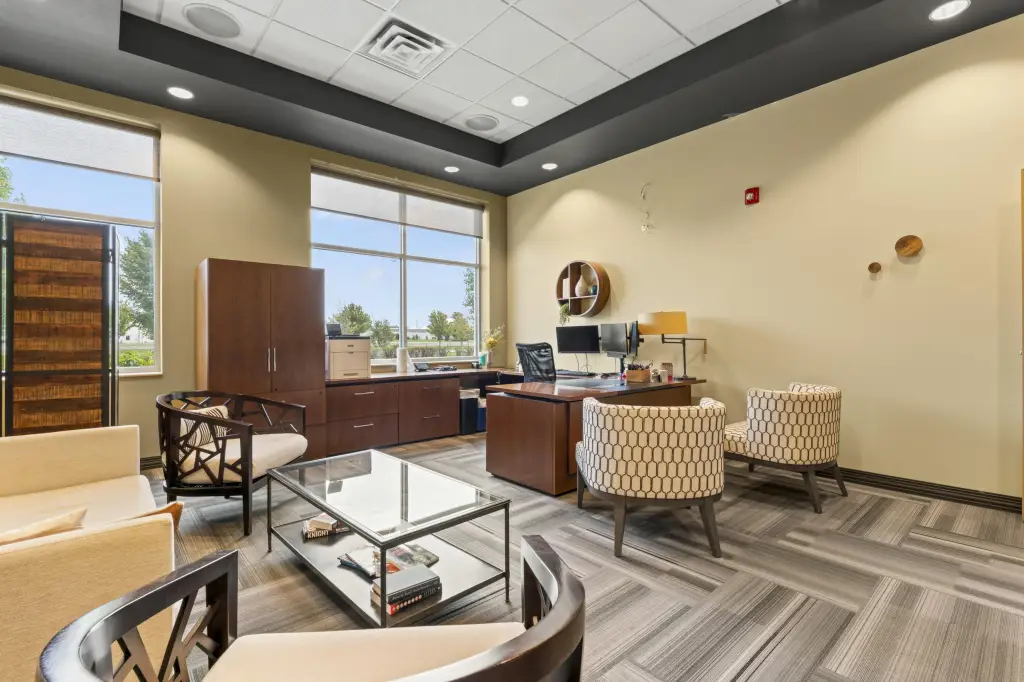
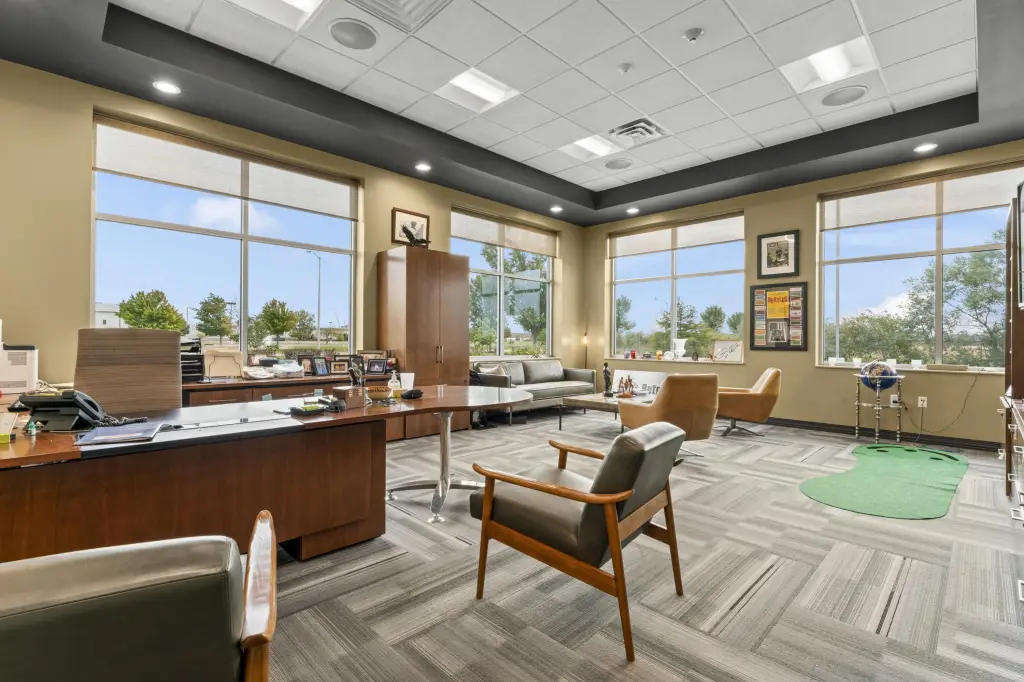
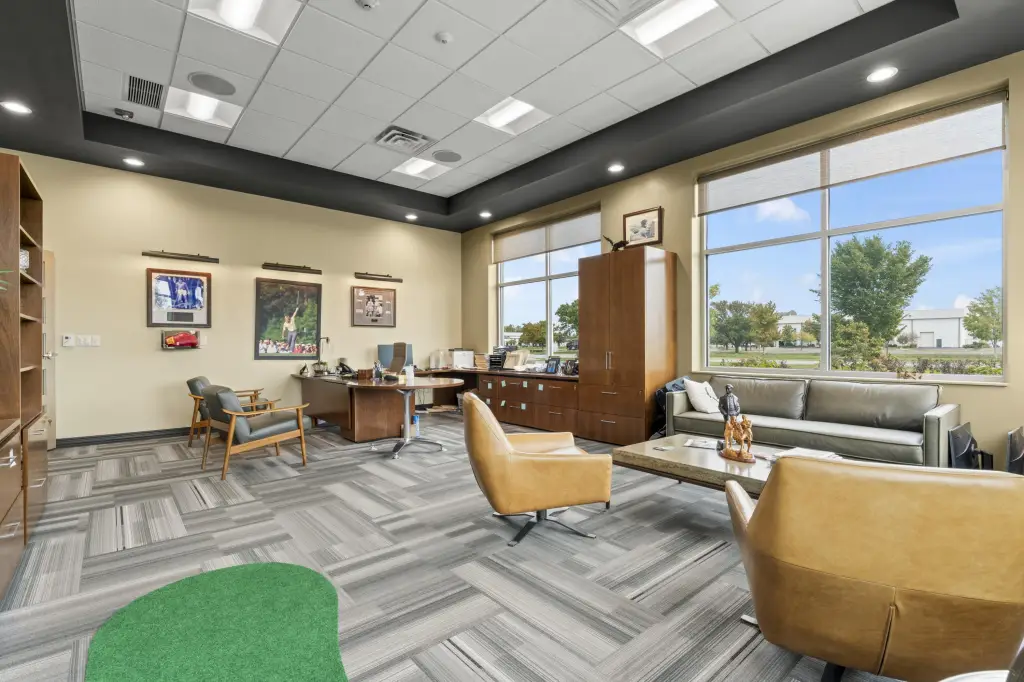
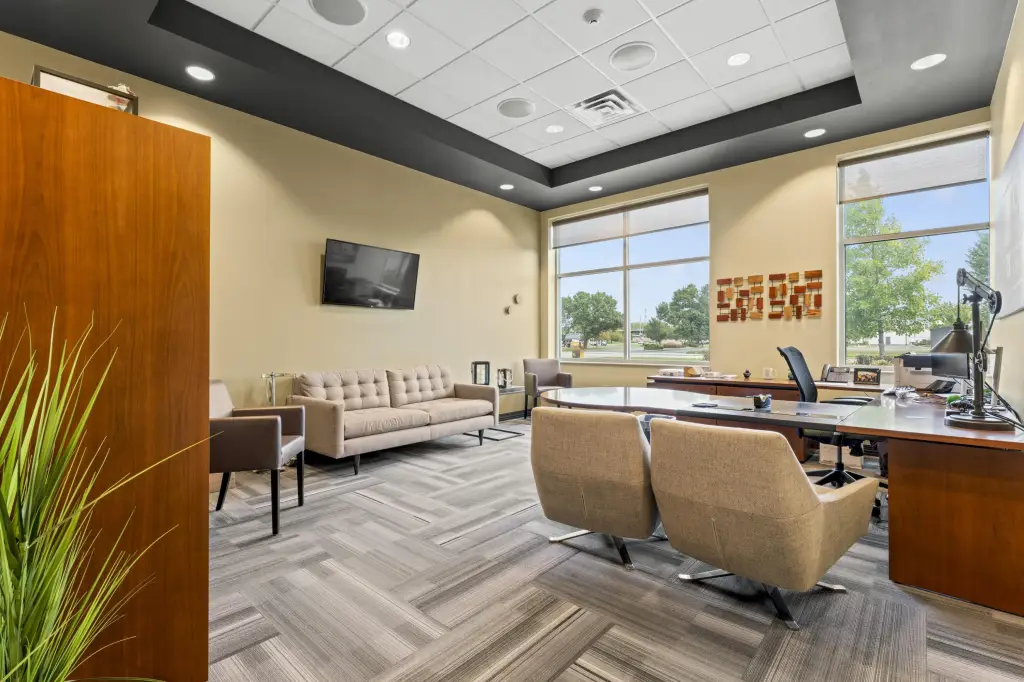
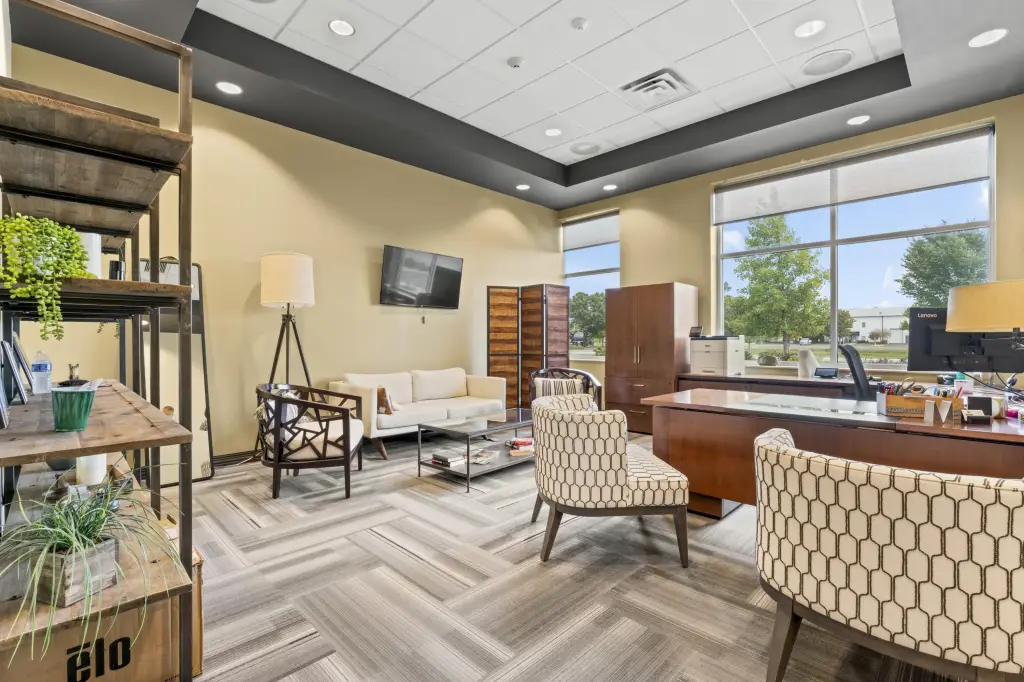
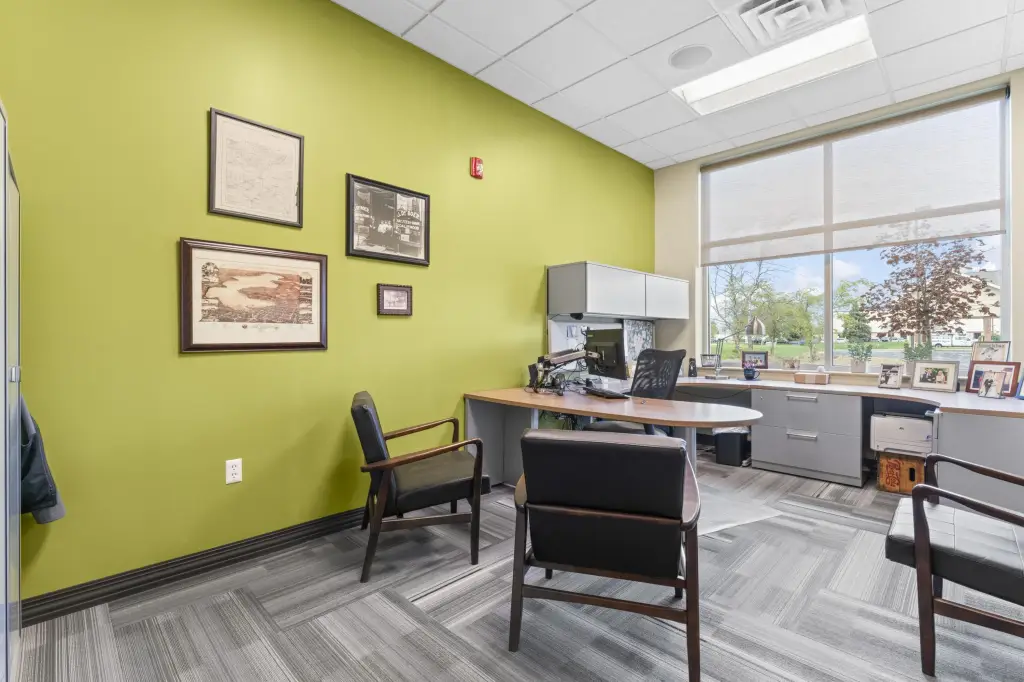
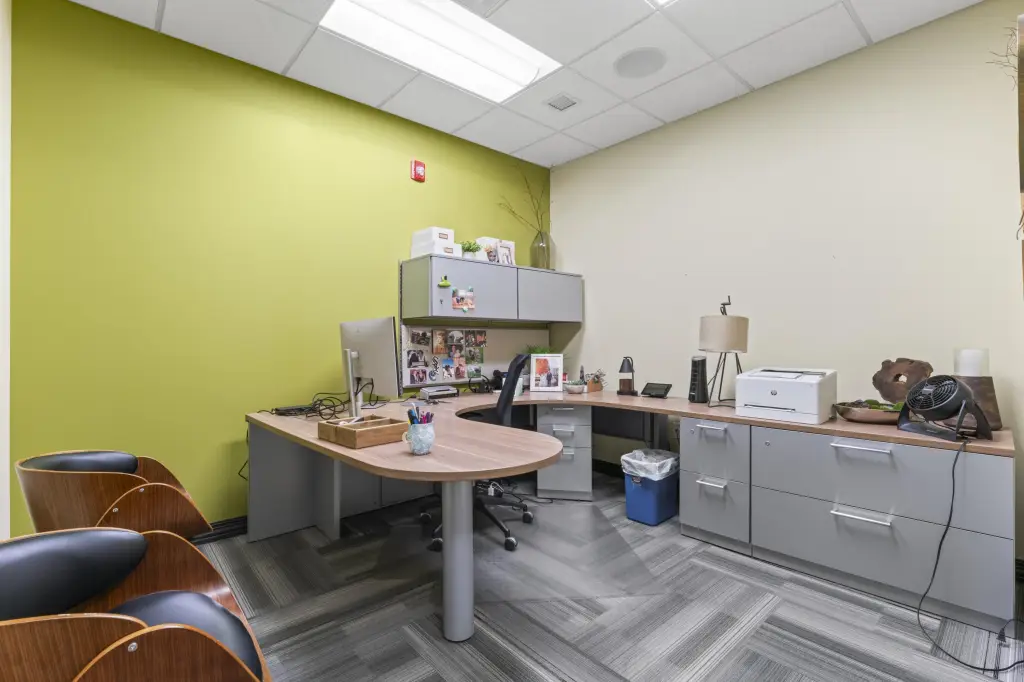
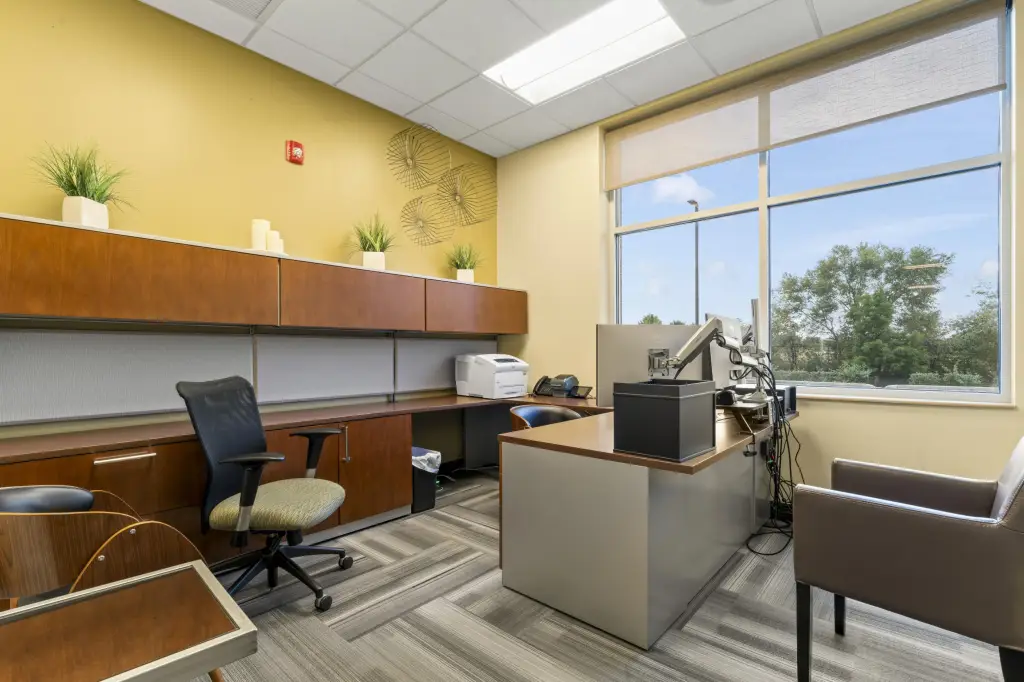
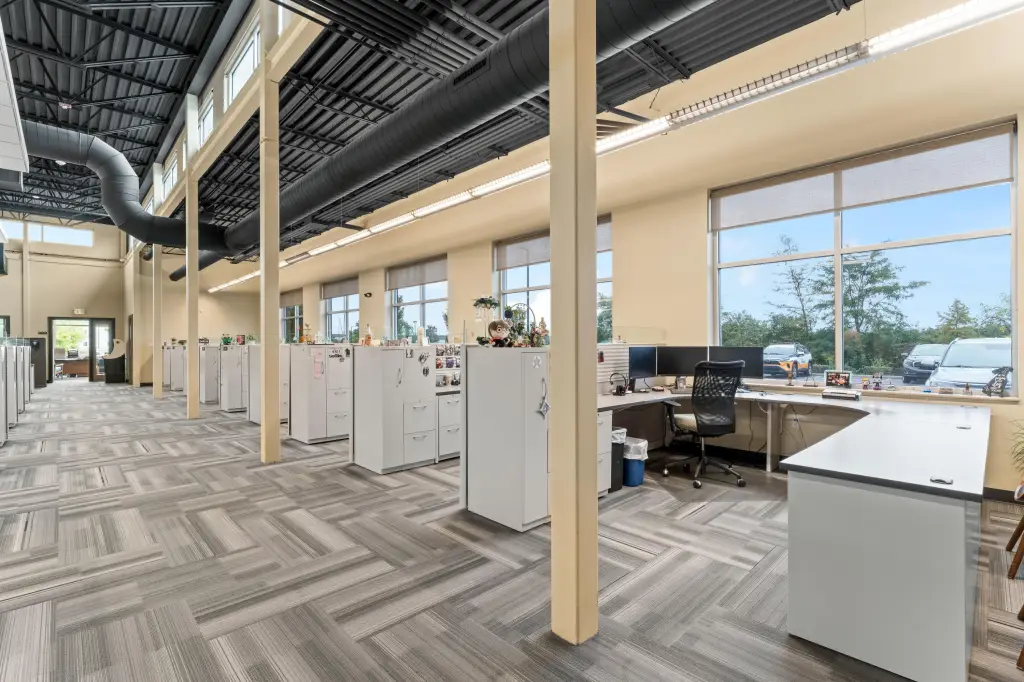
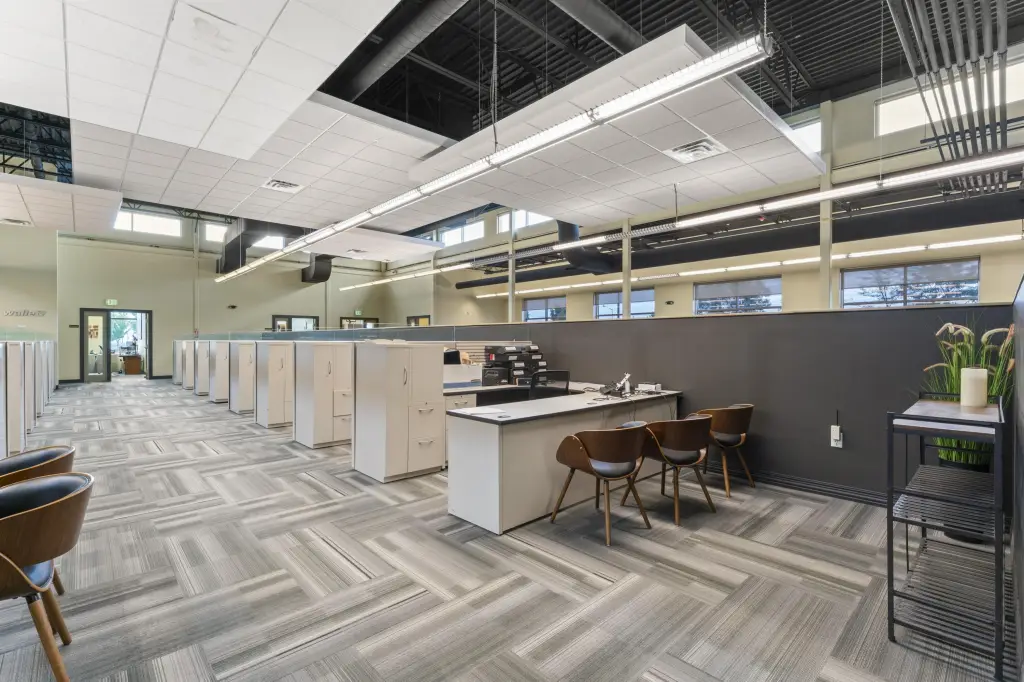
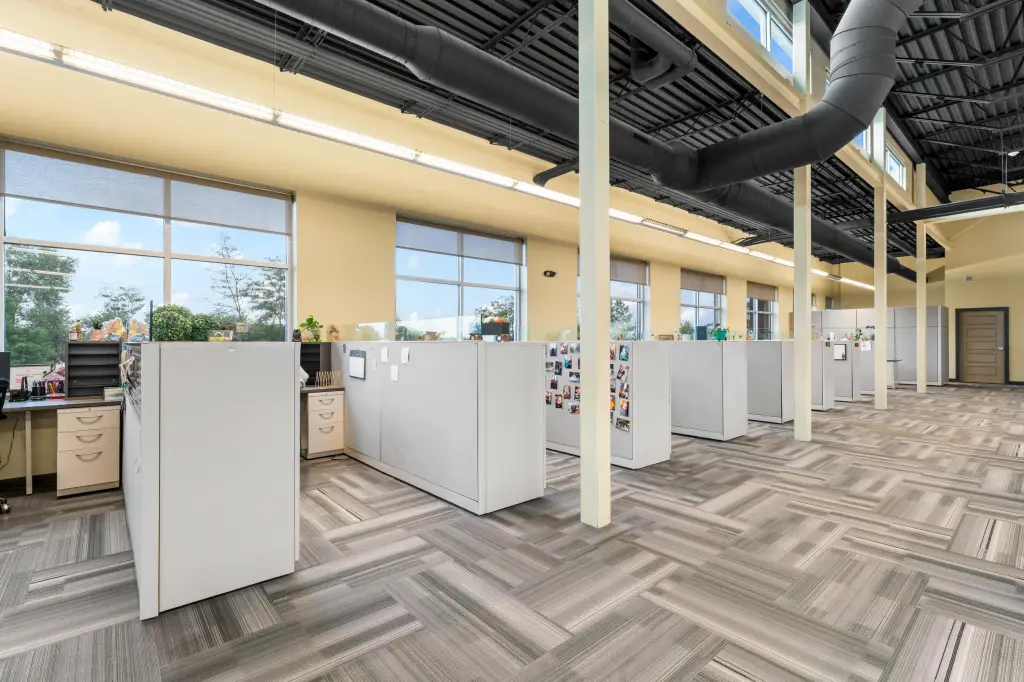
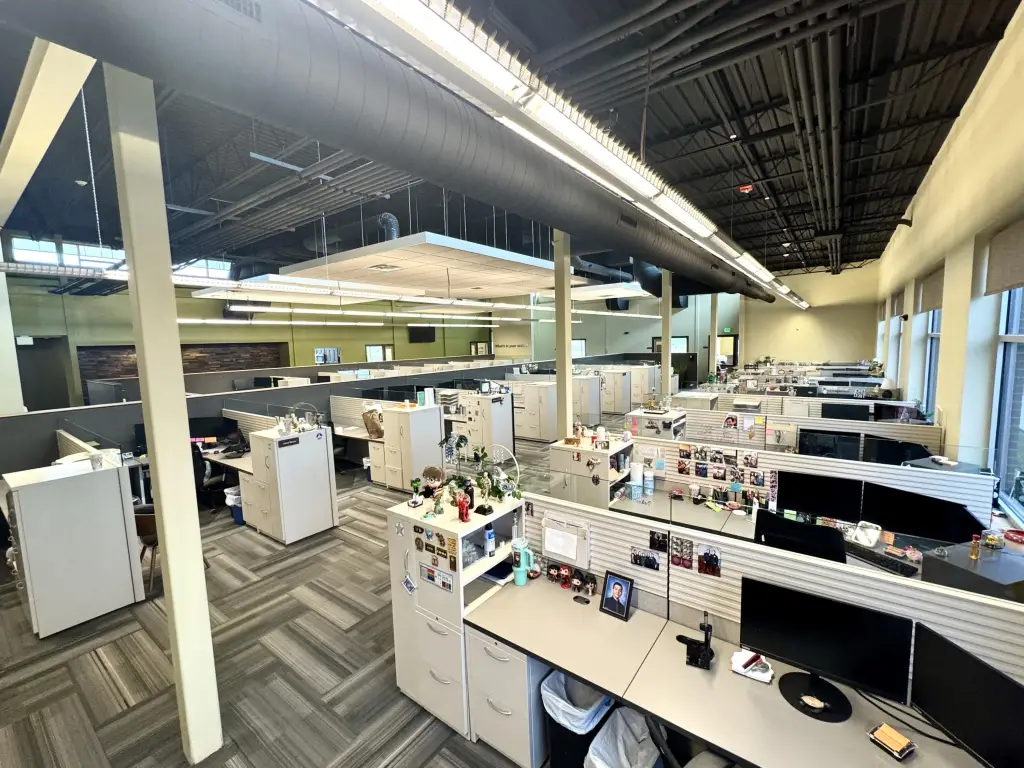
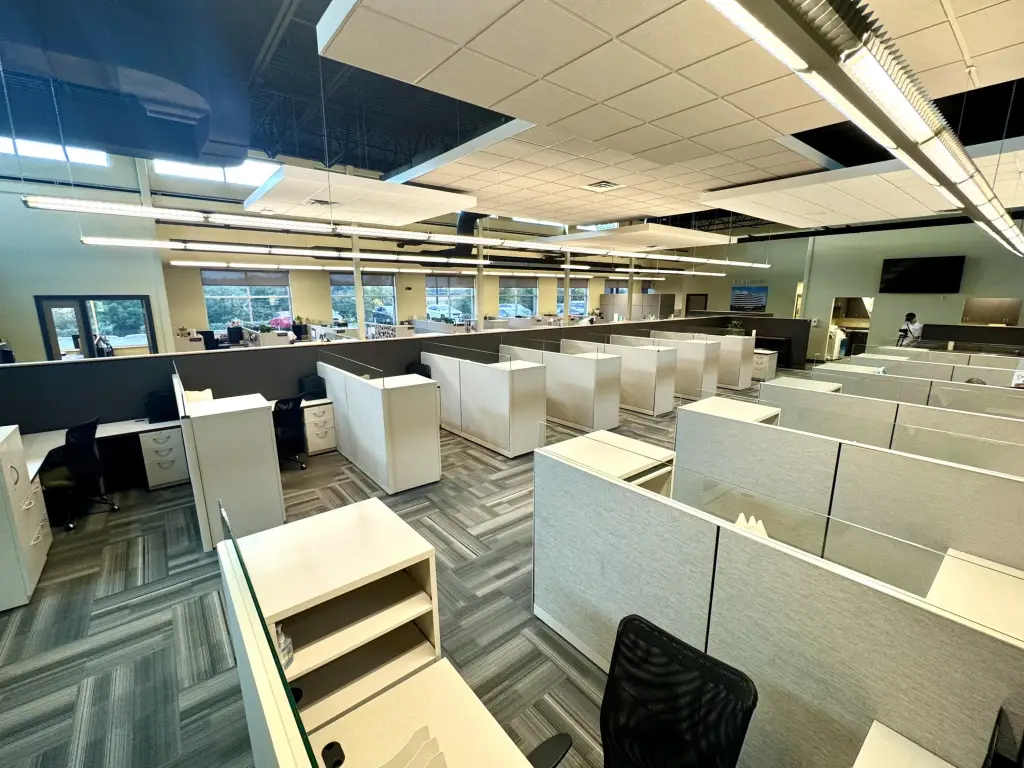
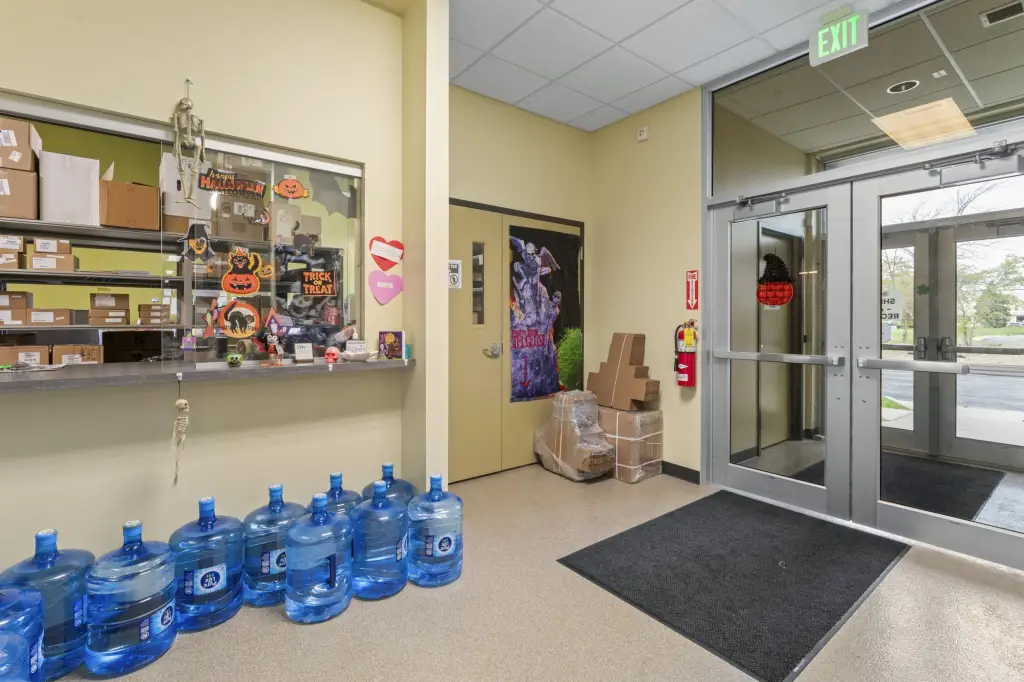
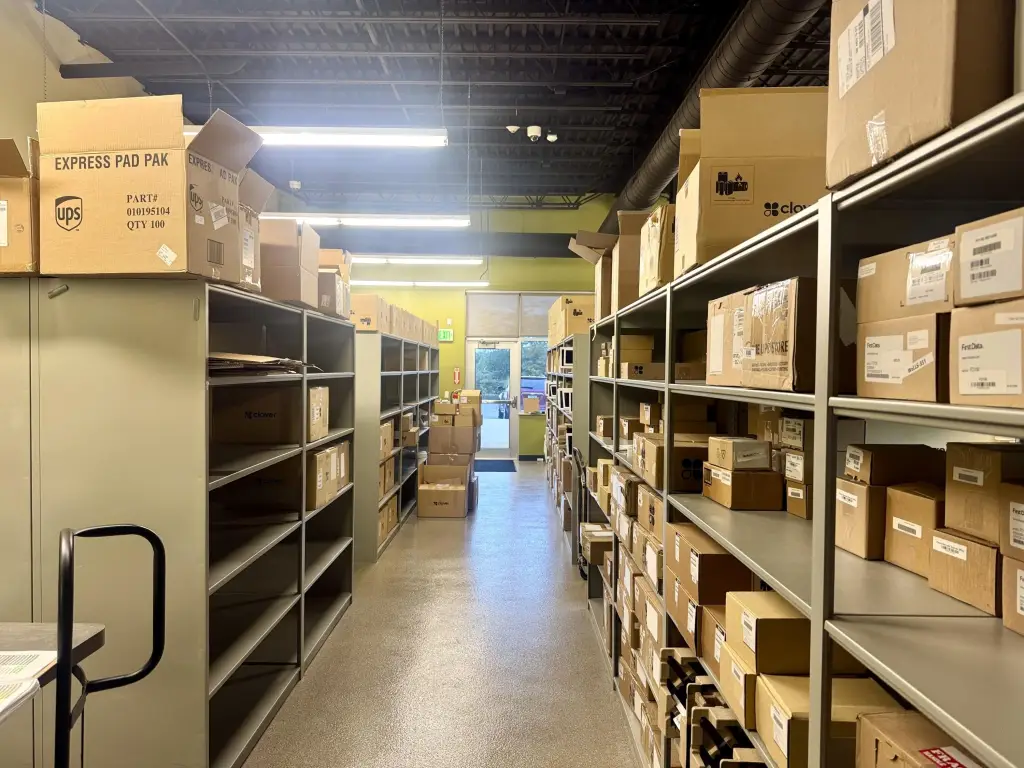
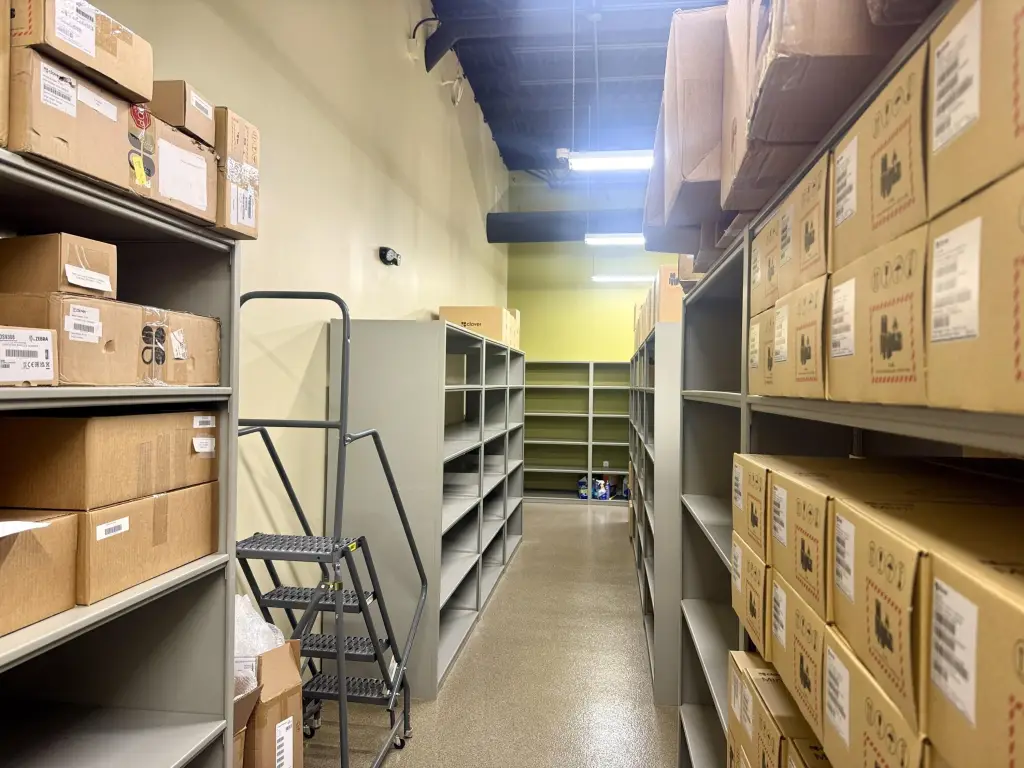
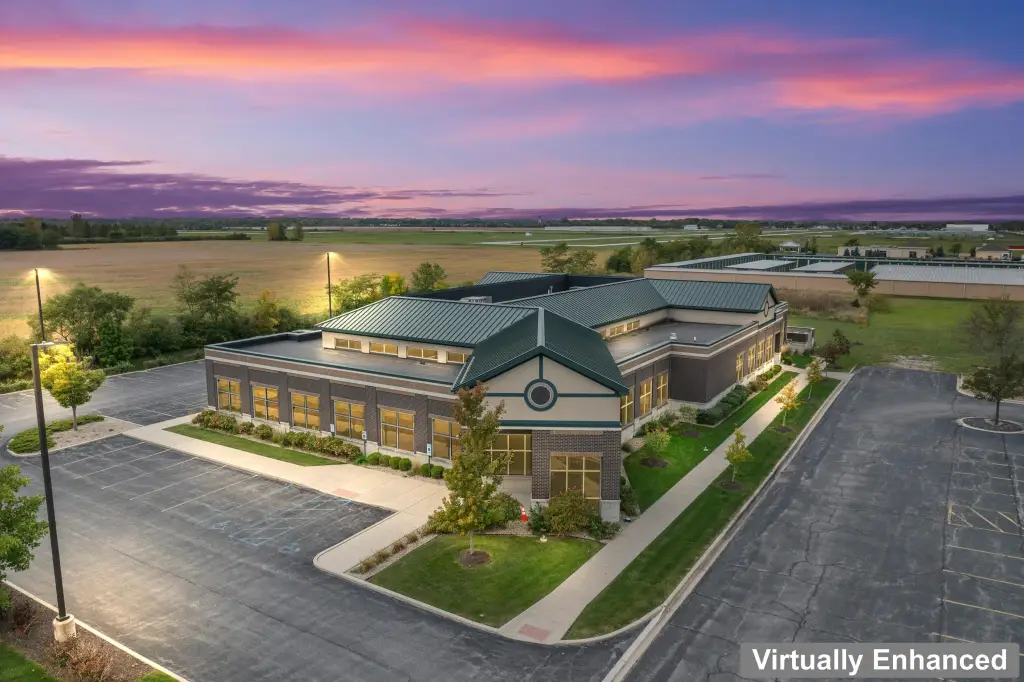
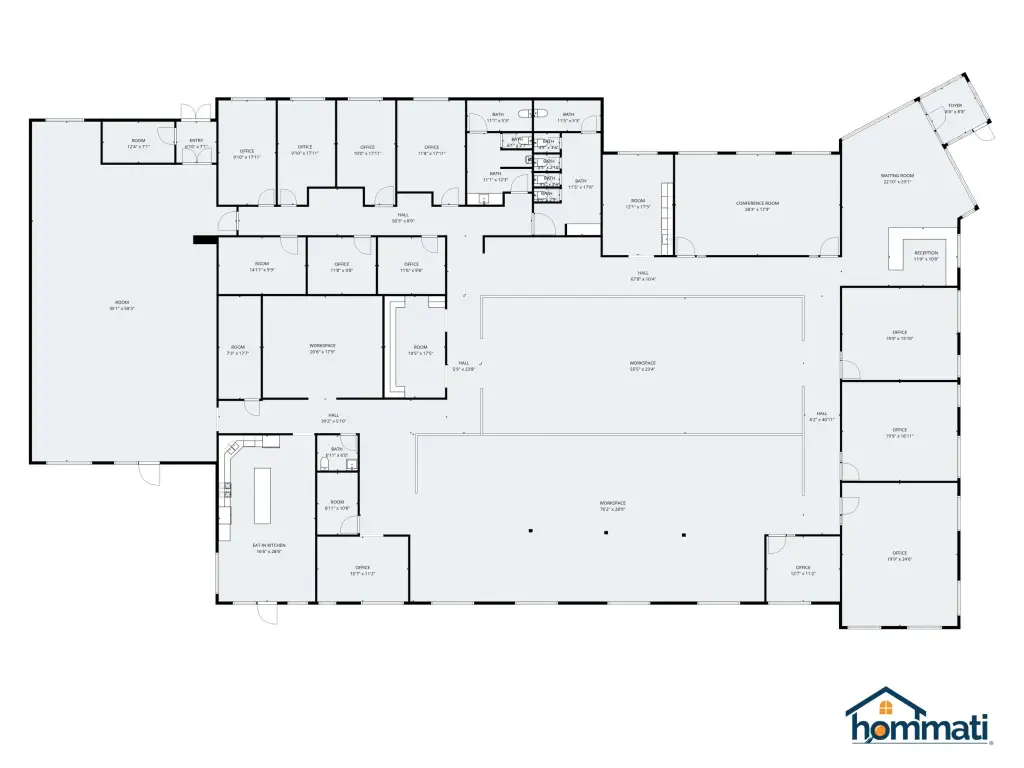
Built in 2017, this 14,534-square-foot office property combines a 13,382-square-foot main building with a 1,152-square-foot garage and storage structure. The interior includes 11 private executive offices, more than 50 workstations, reception and waiting areas, a conference room seating 16, multiple restrooms, copy space, and two employee and visitor break areas, including a full kitchen. Furnishings, desks, chairs, cabinetry, and workstations are included. A shipping and warehouse area supports back-of-house operations, while the exterior provides 63 parking spaces and 4 garage spaces.
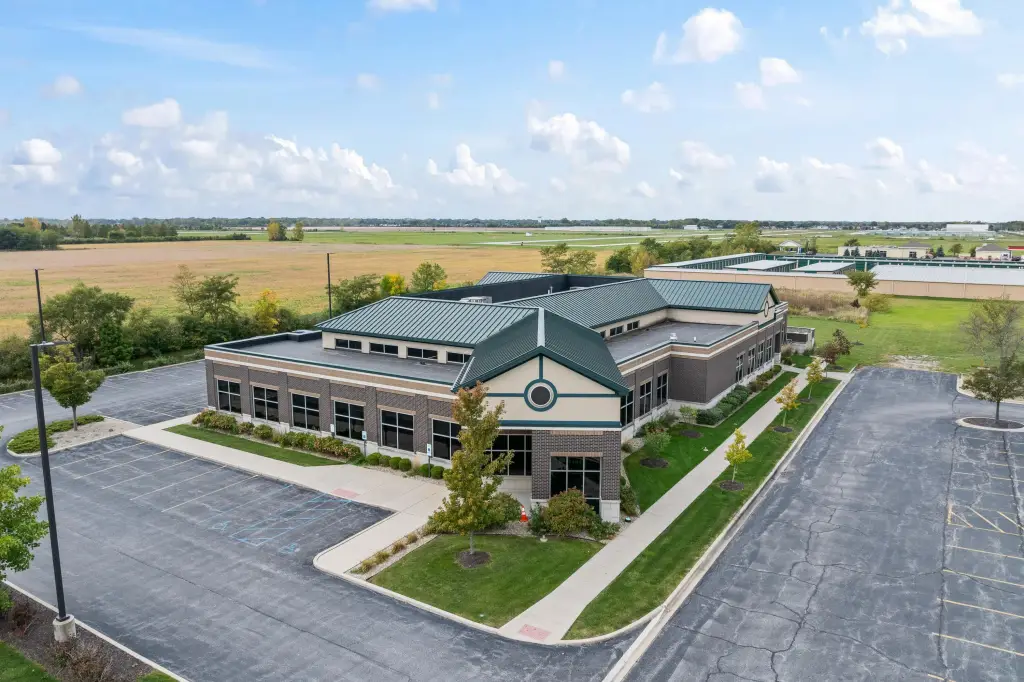
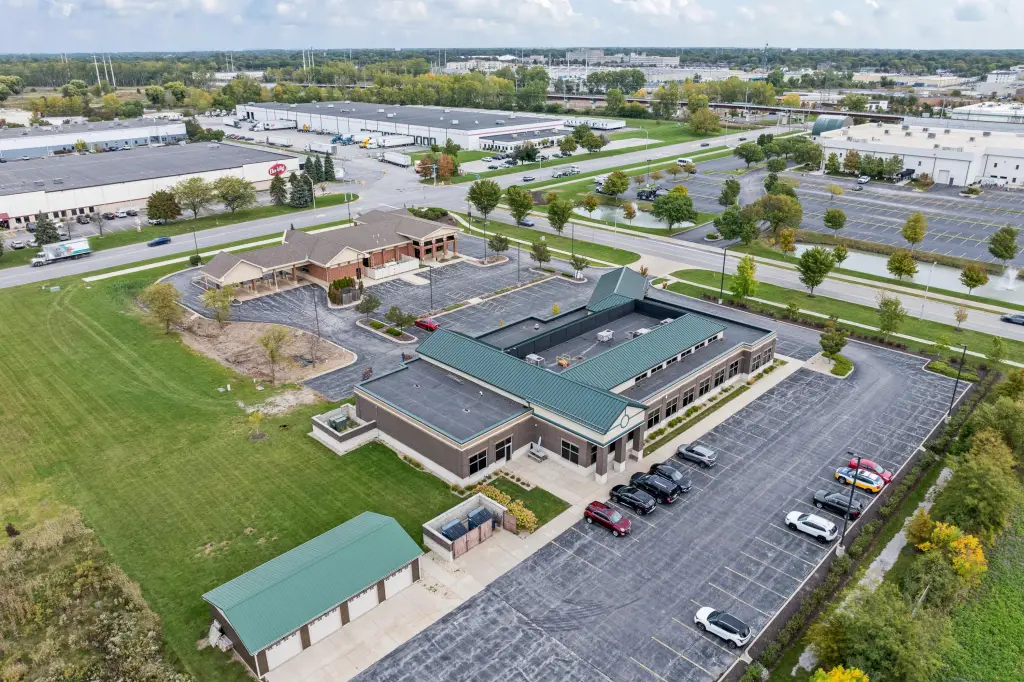
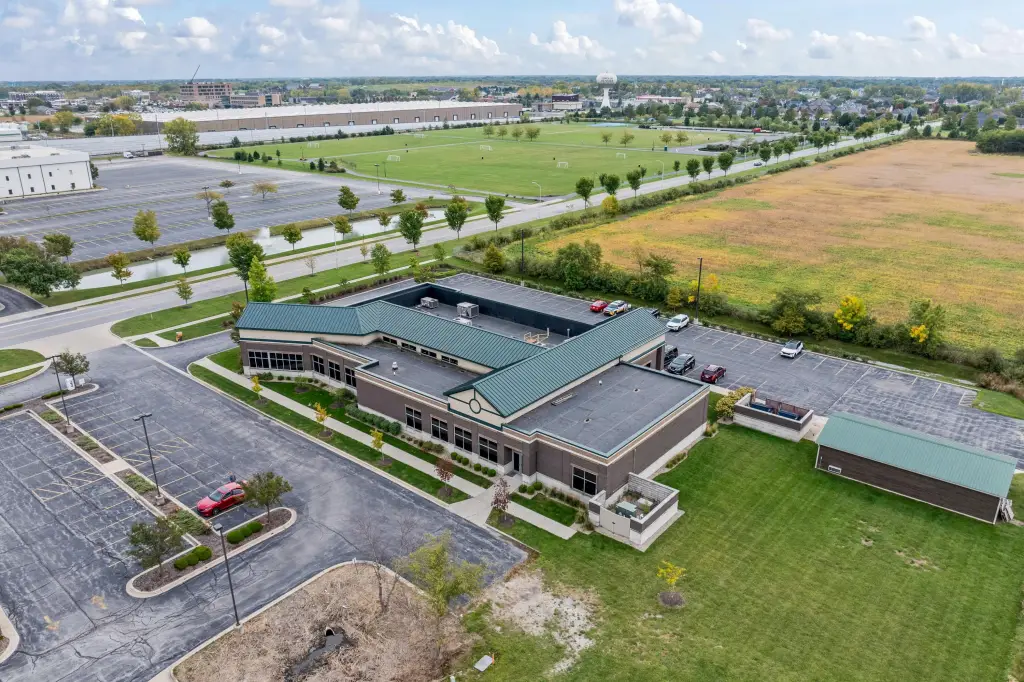
The property sits on 2.327 acres adjacent to 45th Street and Margo Lane in Munster, 0.3 miles from the Indiana/Illinois border and 8 miles southeast of Chicago. Lansing Municipal Airport is 1 mile away, and the Dyer South Shore Commuter Train Station is 3 miles away. The site is also minutes from three area hospitals, with the Munster South Shore Train Station less than 3 miles away.
The property sits on 2.327 acres adjacent to 45th Street and Margo Lane in Munster, 0.3 miles from the Indiana/Illinois border and 8 miles southeast of Chicago. Lansing Municipal Airport is 1 mile away, and the Dyer South Shore Commuter Train Station is 3 miles away. The site is also minutes from three area hospitals, with the Munster South Shore Train Station less than 3 miles away.
Key Highlights
- 14,534‑square‑foot property with a 13,382‑square‑foot office building and 1,152‑square‑foot garage
- 11 private executive offices and more than 50 additional workstations
- Conference room seats 16; reception, waiting, break, kitchen, copy, and warehouse areas included
Financial Insights
Estimated NOI and Cap Rate
NOI / Yr
$203,429
Cap Rate
6.36%
Suggested Prices Based on Cap Rates
Cap Rate 5%
$4,068,580
$4.1M
Cap Rate 7%
$2,906,129
$2.9M
Cap Rate 9%
$2,260,322
$2.3M
Market Conditions
NOI Build-Up for 14,534 SF
Gross rent
$376.7K $25.92/SF
− Vacancy
−$37.7K −$2.59/SF
EGI
$339.0K $23.33/SF
− OpEx
−$135.6K −$9.33/SF
NOI
$203.4K $14.00/SF
Area
Lake County, IN
Vacancy
10.00%
Lease Rate
$25.92 /SF/Yr
Expense Ratio
40.00%
Simulate Cap Rate and NOI
Suggested Prices Based on Cap Rates
Cap Rate 5%
$4,068,580
Cap Rate 7%
$2,906,129
Cap Rate 9%
$2,260,322
Alternative Uses
Best Use
Healthcare Medical
$2.91M
$2.54M – $3.39M
NOI $203,429 @ 7.0% cap · market cap 6.36%
Second Best
Office B
$2.63M
$2.30M – $3.07M
NOI $184,358 @ 7.0% cap · market cap 5.76%
Theoretical Best
Specialty Retail
$4.06M
$3.55M – $4.73M
NOI $284,013 @ 7.0% cap · market cap 8.88%
Zoning and permitted uses should be independently verified with authorities.
How Realmo checks its estimates
Property Analytics
Unlock full access to Insights
Subscribe to Realmo Intelligence
Open Analytics
Current Use
Lease Details
Yes
Paved road access
Location Intelligence
Trade Area within ½ mile
321
Businesses Nearby
Explore this area
Business Placement
Demographics for 46321, IN
23,894
Population
9,786
Households
2.4
Avg Household Size
45
Median Age
48%
College-Educated
96%
High-School Grad
7.6 sq mi
ZIP Area
3,144
Density / Sq Mi
$105,764
Median Household Income
$57,796
Median Earnings
$1,480
Median Rent
$312,000
Median Home Value
Check the figures for this property
Cap Rate, Value Estimation, Potential NOI and more
View Realmo Analytics
Market
Vacancy Rate% for Office in Midwest region

Questions? Ask Rey
Realmo’s AI knows this listing — price, zoning, demand, history. Ask anything.


Frequently Asked Questions
What type of property is this?
Office building - Office and medical space with executive offices, open work areas, warehouse functions, and furnished workstations.
Where is this office building located?
The property is located at 9404 Margo Lane Munster, IN.
What is the asking price?
The asking price for this property is $3,200,000.
What are key features of this property?
This property features: 14,534‑square‑foot property with a 13,382‑square‑foot office building and 1,152‑square‑foot garage; 11 private executive offices and more than 50 additional workstations; Conference room seats 16; reception, waiting, break, kitchen, copy, and warehouse areas included