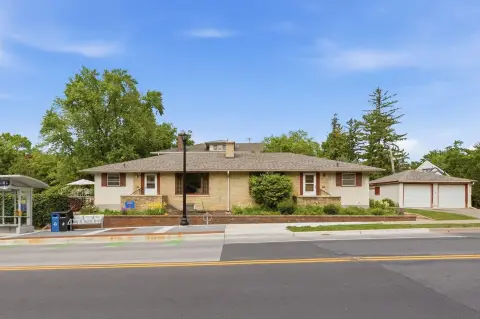
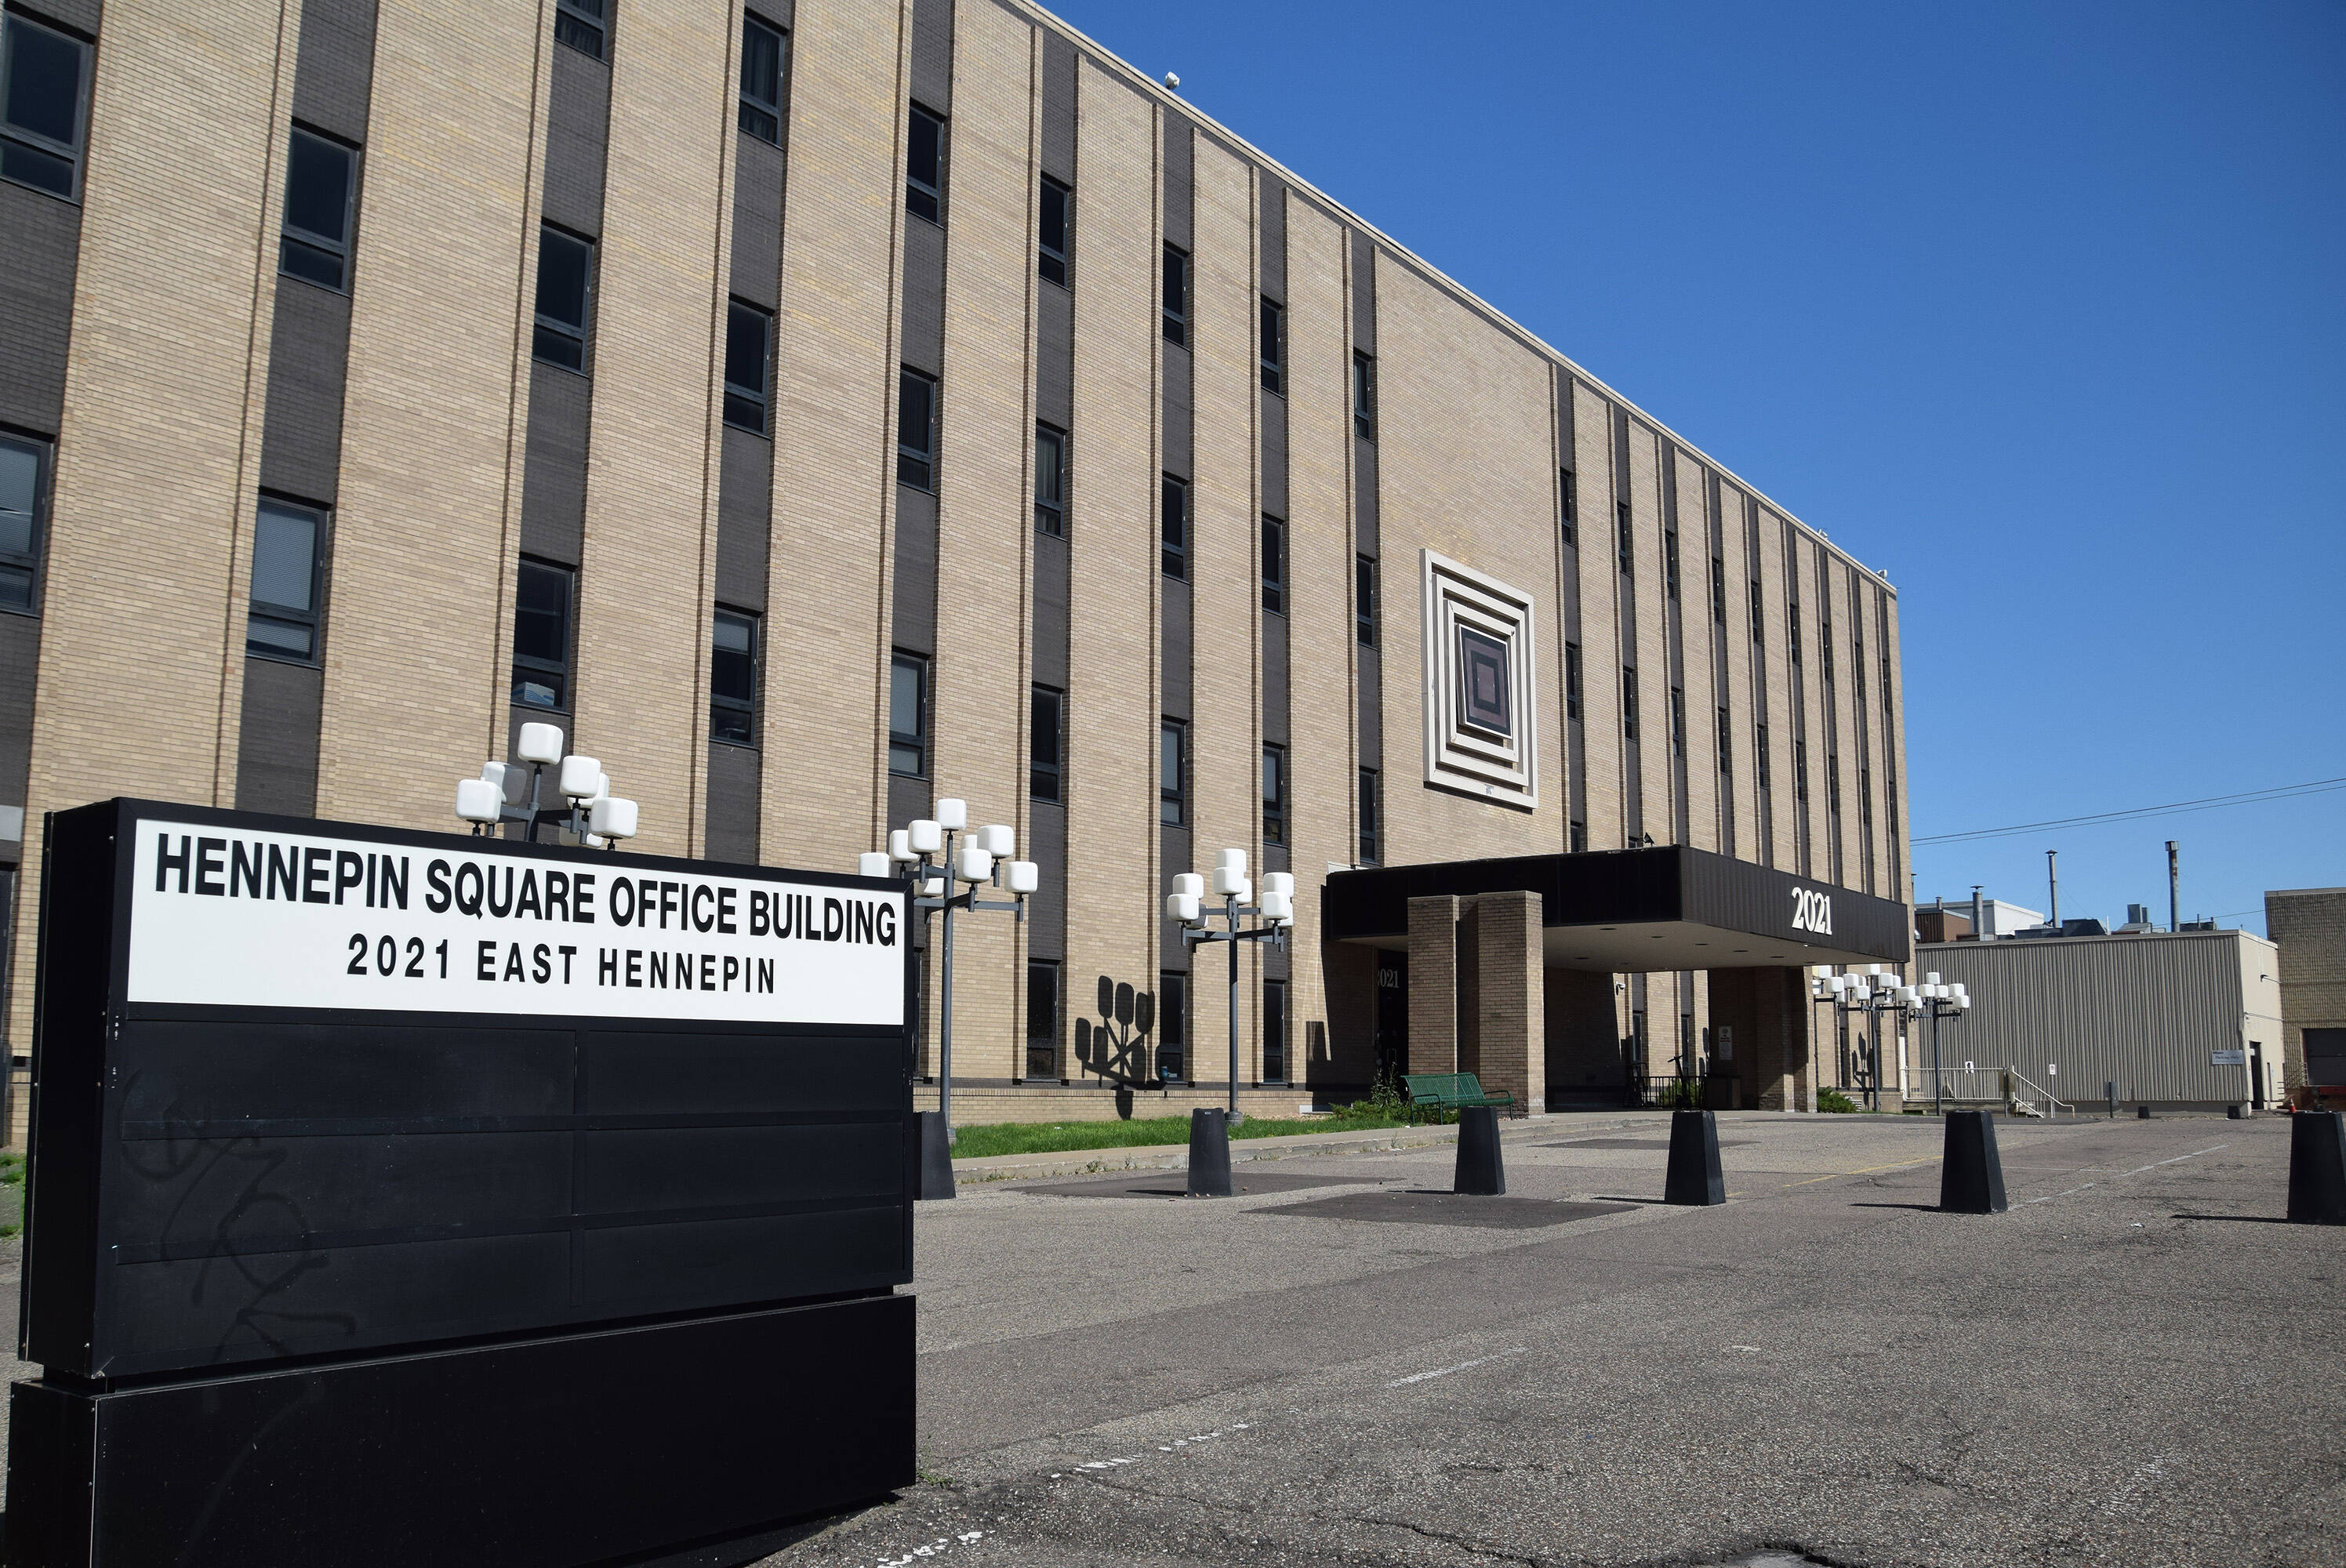
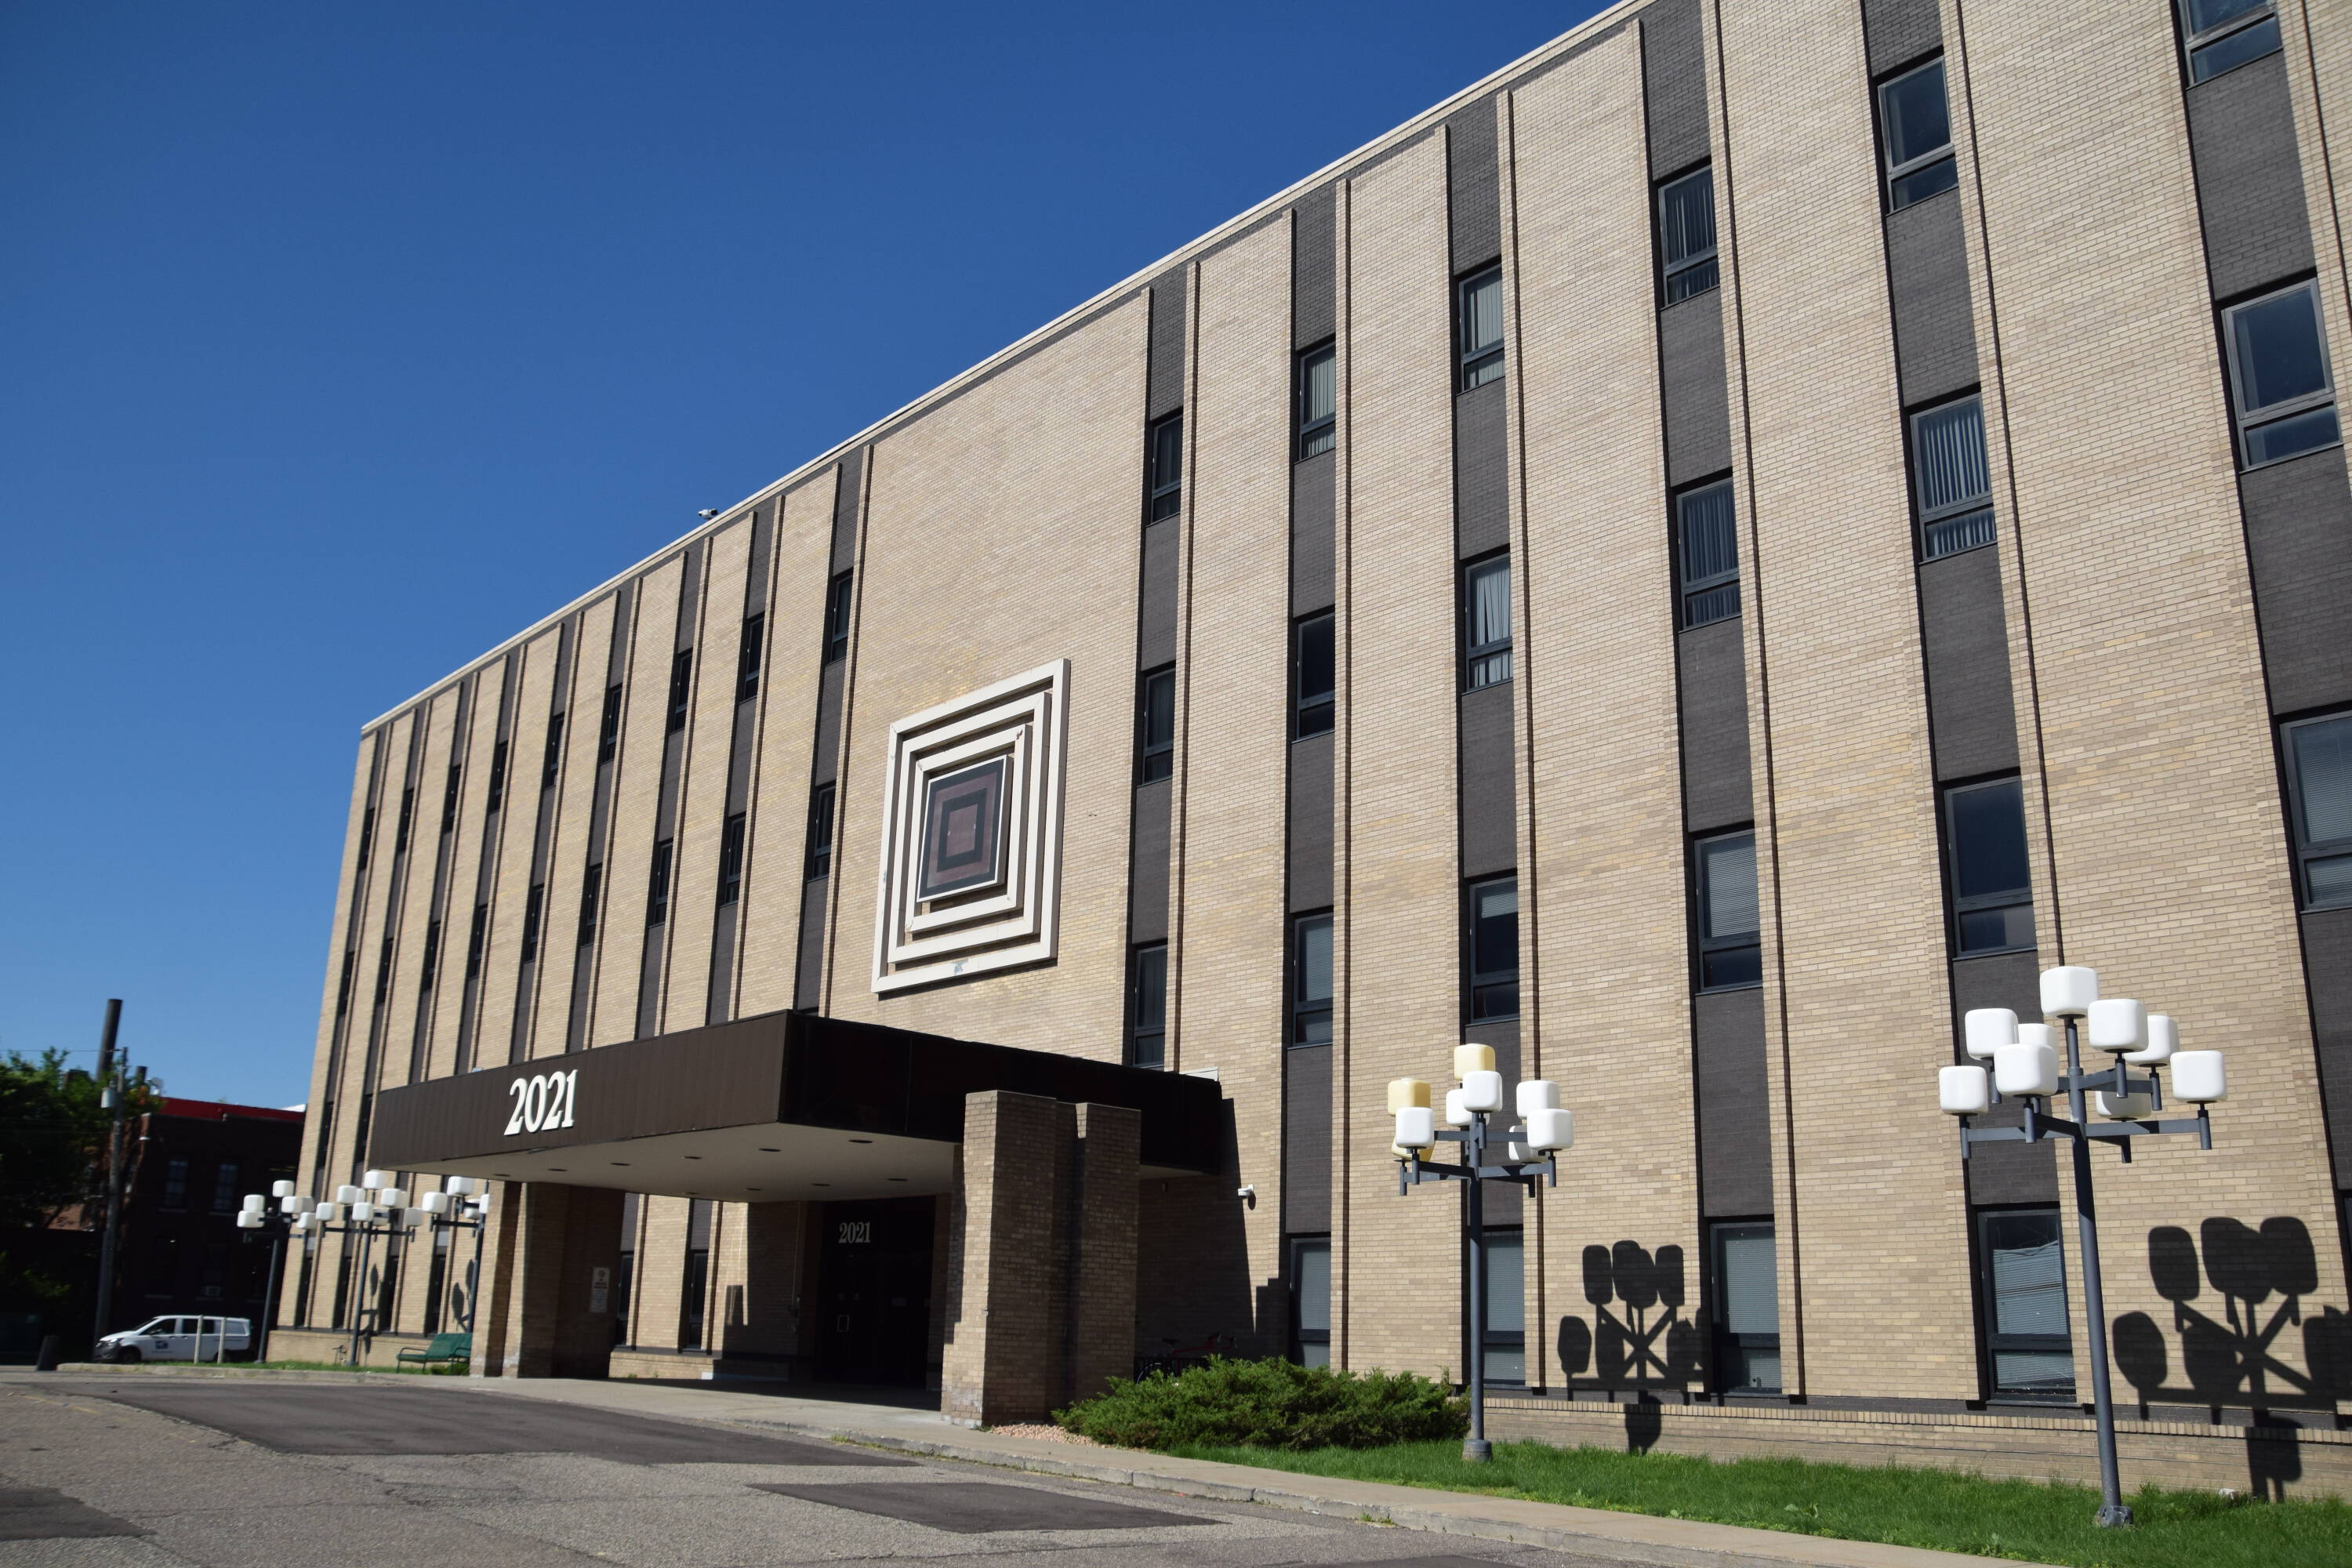
This exceptional 95,500 square foot office building, located at 2021 E Hennepin Ave in Minneapolis, MN 55413, presents a unique owner/user opportunity. Built in 1923, this five-story, single-building property boasts a prime location in the heart of the Twin Cities, offering easy access to both Minneapolis and Saint Paul downtowns. The building's convenient access to major highways, including I-35, I-94, MN 36, and MN 280, ensures seamless commutes for employees and clients. Beyond its strategic location, the property benefits from its proximity to a vibrant array of amenities. Enjoy nearby independent art galleries, diverse dining options, specialty coffee shops, micro-breweries, distilleries, and entertainment venues. The Quarry Retail District, featuring major retailers such as Target, Cub Foods, Home Depot, and PetSmart, is also within close proximity. Building amenities include two large common conference rooms and a full concierge service, enhancing the overall tenant experience. Furthermore, a METRO Transit bus stop is conveniently located on East Hennepin Avenue, providing easy access to public transportation. This property offers a blend of classic charm and modern convenience, making it an ideal investment for discerning businesses. The APN is 18-029-23-33-0046.
Property Features for 2021 Hennepin Ave
General Information
Property type
Office Properties & Spaces
Square Feet
95,500 SF
Building Details
Year Built
1923
Buildings
1
Stories
5
We can help!
Listing Contact
Nils Snyder
Learn more
Property Insight Report
HighLights
Prime Twin Cities location, near both Minneapolis and Saint Paul downtowns.
Excellent highway access via I‑35, I‑94, MN 36, and MN 280.
Walkable to diverse local amenities including restaurants, breweries, and entertainment.
Near major retailers at the Quarry Retail District (Target, Cub Foods, Home Depot, etc.).
Building features include two large conference rooms and concierge service.
Convenient METRO Transit bus access on East Hennepin.
Twin Cities PrideFestivalFreeman Mark JAttorneyNirenstein David OLawyerMSP Home Health ...Home Health Care ServiceCommon Properties Management ...Property Management Company
Office Property / Space - 95,500 SF Minneapolis Office Space
Where is this office property / space located?
The property is located at 2021 Hennepin Ave Minneapolis, MN.
What are key features of this property?
This property features: Prime Twin Cities location, near both Minneapolis and Saint Paul downtowns.; Excellent highway access via I-35, I-94, MN 36, and MN 280.; Walkable to diverse local amenities including restaurants, breweries, and entertainment.
If you are the owner or broker of this property and would like to edit or remove this listing please send a message to web site administrator.
2021 Hennepin Ave Minneapolis, MN 55413
Message sent successfully
Error
Email to Your Friends
Message sent successfully
Error
Realmo Value Estimations
Realmo estimates a property’s market value using a proprietary methodology that incorporates public data and user-submitted information. This cumulative value is generated by integrating a variety of conventional and innovative methods.
Disclaimer
These figures are not official appraisals and should not be used as a substitute for a valuation performed by a licensed appraiser.
Actual market value may differ due to factors not captured in the data. Estimates are offered for informational purposes only, and users should conduct independent research before making financial or investment decisions.
By using this feature, you acknowledge that Realmo is not responsible for actions taken based on these estimates.
AI approach
Realmo AI Method estimates property value using machine learning models trained on millions of comparable listings, transactions, and market signals. It analyzes property features, location intelligence data, and current market dynamics to predict the most probable market value in real time.
Realmo CapRate Calculation
Realmo calculates the Capitalization Rate (Cap Rate) to help estimate a property's potential return on investment. The Cap Rate is a fundamental metric in commercial real estate that measures the relationship between a property's net operating income and its market value.
How We Calculate Cap Rate
Cap Rate Formula: Cap Rate (%) = (Net Operating Income / Property Value) × 100
Net Operating Income (NOI) Formula: NOI = Area × Lease Rate × (1 - Vacancy Rate) × (1 - Operating Expense Ratio)
Components
Net Operating Income (NOI) represents the annual income a property generates after operating expenses:
Area: Building square footage from property records
Lease Rate: Annual $/sqft based on market data for the property type and geographic location
Vacancy Rate: Percentage of unoccupied space based on market data for the property type and location
Operating Expense Ratio: Operating costs as a percentage of income, varies by property type
Property Value is derived from:
Recent sale price (if available)
Statistical models using comparable sales
AI-powered valuation estimates
Example Calculation
For a 100,000 sqft Office Building:
Lease Rate: $25.00/sqft/year (market data for Office in this area)
Vacancy Rate: 8% (market data for Office in this area)
Operating Expense Ratio: 35% (typical for Office properties)
Property Value: $15,000,000
Step 1: Calculate NOI
NOI = 100,000 × $25.00 × (1 - 0.08) × (1 - 0.35) NOI = 100,000 × $25.00 × 0.92 × 0.65 NOI = $1,495,000/year
Step 2: Calculate Cap Rate
Cap Rate = ($1,495,000 / $15,000,000) × 100 Cap Rate = 9.97%
Property Type Considerations
Net Operating Income calculations vary by property type due to different operating expense ratios:
Office: Higher expenses (30-40%) for HVAC, utilities, maintenance
Retail: Moderate expenses (25-35%) for common area maintenance
Industrial/Warehouse: Lower expenses (15-25%) for minimal tenant services
Multifamily: Moderate expenses (35-45%) including property management
Self-Storage: Lower expenses (25-35%) due to minimal maintenance
Market lease rates and vacancy rates are specific to each property type and geographic location, reflecting local market conditions.
Disclaimer
These calculations are estimates for informational purposes only and should not be used as a substitute for professional financial analysis or appraisal.
Cap Rate calculations depend on market data that may change over time
Actual operating expenses, lease rates, and vacancy rates may differ from market averages
Individual property conditions, lease terms, and tenant quality significantly impact actual NOI
Property value estimates are approximations and not official appraisals
Cap rates vary widely by market, property condition, and investment risk profile
Professional Guidance Recommended: Before making any investment or financial decisions, consult with licensed appraisers, commercial real estate brokers, and financial advisors who can evaluate your specific property and circumstances.
By using this feature, you acknowledge that Realmo is not responsible for investment decisions or actions taken based on these estimates.
Cap approach
Capitalization Method calculates value based on estimated net operating income (NOI) and applying a market-based capitalization rate (cap rate), we estimate what a typical investor might be willing to pay for it.
Comparable approach
Comparable estimate is based on recent sales of similar nearby properties, adjusted for factors like size, condition, and location.
Relative
Relative property class coefficient uses factors that account for typical price differences between various asset types (e.g., retail vs. industrial) to provide a more accurate market-aligned estimate.
Geo
Comparable Sales Method, enhanced by Geo coefficients — location-based adjustment factors that reflect differences in price levels
across neighborhoods, cities, or regions ensuring a more accurate, market-sensitive valuation.
Stat Estimate
This method estimates value based on actual market adjusted recent (~5 years) sales of comparable properties around by location and property type.
Ranges - area data calculated by industry standard IQR Outlier Removal Method
Range-from: 75% of all similar sales ($/sqft) are above this value
Range-to: 75% of all similar sales ($/sqft) are below this value
AI Estimate
This method estimates value based on AI market estimation of comparable properties around by location and property type.
Ranges - area data calculated by industry standard IQR Outlier Removal Method
Range-from: 75% of all estimations ($/sqft) are above this value
Range-to: 75% of all estimations ($/sqft) are below this value
Alternative use
Estimate considers the property’s potential value if used for a different purpose-based on zoning, demand, and market feasibility.
More about this property
2021 Hennepin Ave Minneapolis, MN 55413
More about this listing
2021 Hennepin Ave, Minneapolis, MN
Contact
Nils Snyder
Your message was sent
Please view email to read information.
Check the junk/spam folder if no email is in the inbox.
Error
Your message wasn't sent. Try again
Request price
2021 Hennepin Ave, Minneapolis, MN
Contact
Nils Snyder
Your message was sent
Please view email to read information.
Check the junk/spam folder if no email is in the inbox.
Error
Your message wasn't sent. Try again
Property Records & Analytics
2021 Hennepin Ave, Minneapolis, MN
Your message was sent
Please view email to read information.
Check the junk/spam folder if no email is in the inbox.
Error
Your message wasn't sent. Try again
Request Owner's contact information
2021 Hennepin Ave, Minneapolis, MN
Your message was sent
Please view email to read information.
Check the junk/spam folder if no email is in the inbox.
Error
Your message wasn't sent. Try again
Current Estimation by Request
2021 Hennepin Ave, Minneapolis, MN
Your message was sent
Please view email to read information.
Check the junk/spam folder if no email is in the inbox.
Error
Your message wasn't sent. Try again
Send Message
to 2021 Hennepin Ave Minneapolis, MN 55413
2021 Hennepin Ave, Minneapolis, MN
Contact
Nils Snyder
Your message was sent
Please view email to read information.
Check the junk/spam folder if no email is in the inbox.