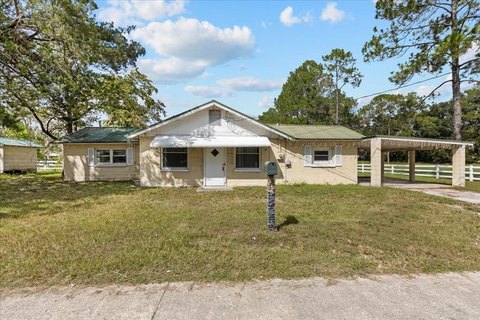
503 Wade St Trenton, FL 32693
Turnkey Business, High Traffic Area
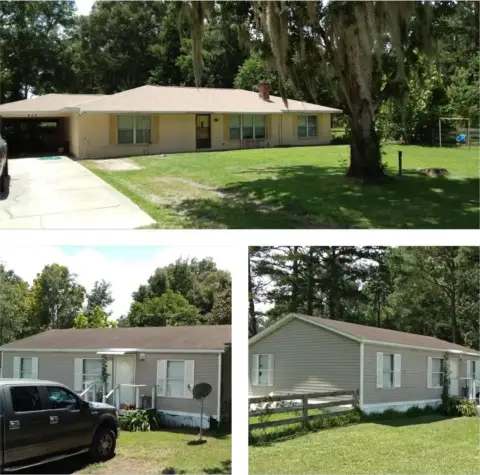
Property Features for 503 Wade St
General Information
- Property type
- Day care centers
- Square Feet
- 2,124 SF
Building Details
- Year Built
- 1965

Listing Agency: Hatcher Realty Services, Inc. Listing Agent: Dewey Hatcher
Displayed information is deemed reliable but is not guaranteed and should be independently verified.
Overview
Current Use by Public Records
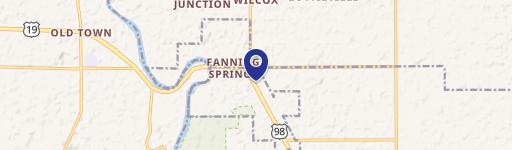
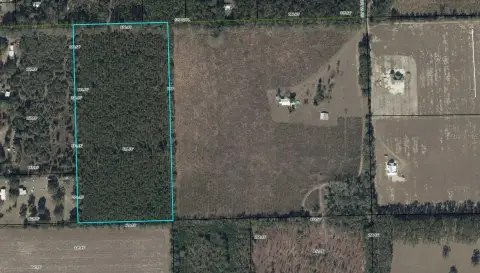
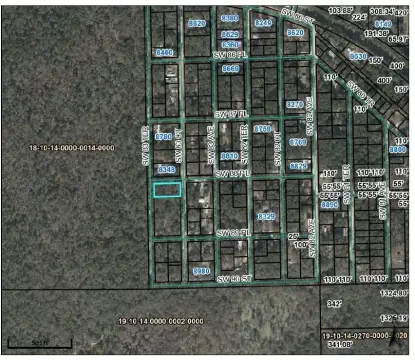
Location Insight
- Map
- Local Demand
- City
- Trenton
- County
- Gilchrist
- State
- Florida
- Longitude
- -82.8229811
- Latitude
- 29.613588