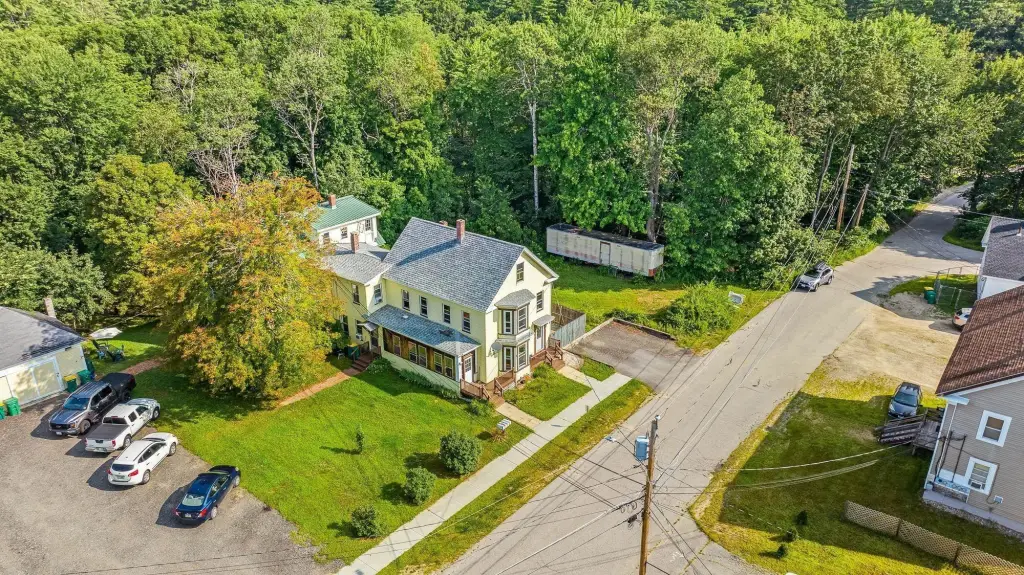
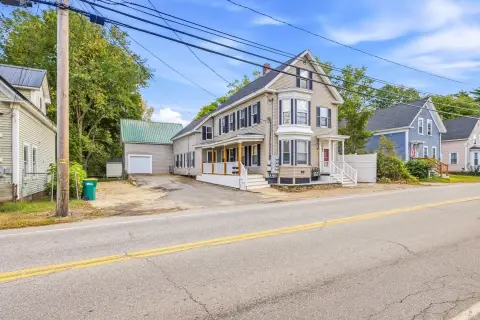
Waterfront Quadplex with River

For Sale
$899,000
32 Mill Street, Rochester, NH 03867
Multi-Family, Rochester, NH
Property Size4,528 SF
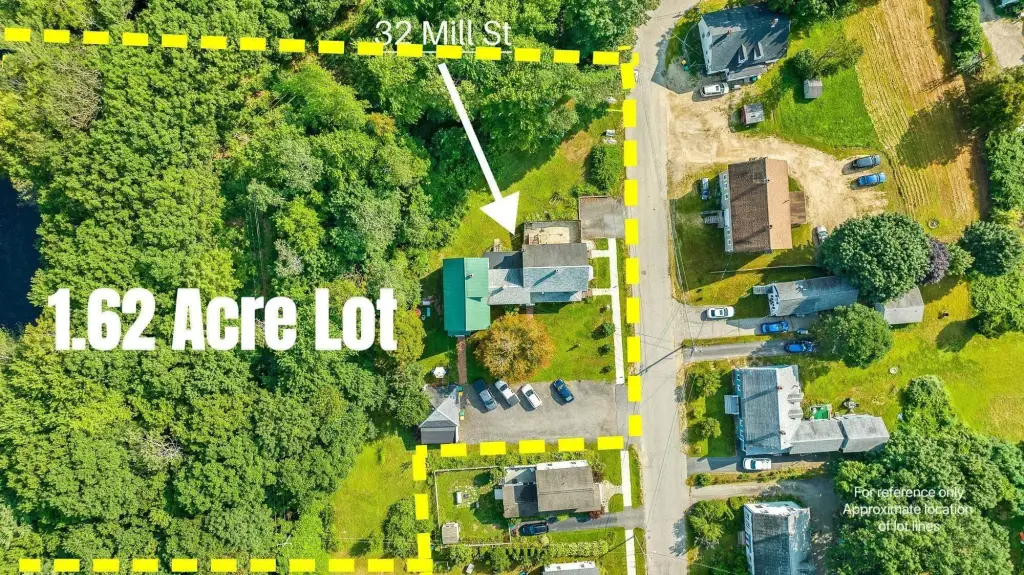
Lot Size1.62 Acres
Price / SF$198.54
Days on Market541
Property Features for 32 Mill Street
General Information
Property type
Residential Multi Family
Property subtype
Other
Zoning
R2
Bedrooms
8
Bathrooms
6
Full bathrooms
6
Rooms
Bathroom 3, Bathroom 5, Bedroom 4, Bathroom 2, Bedroom 5, Bedroom 1, Bedroom 2, Bedroom 6, Bedroom 8, Bedroom 7, Basement, Bathroom 4, Bathroom 6, Bedroom 3, Bathroom 1
Lot features
Corner, Landscaped, Sidewalks
Elementary school
East Rochester School
Middle school
Rochester Middle School
High school
Spaulding High School
Elementary school district
Rochester City School District
Middle school district
Rochester City School District
High school district
Rochester City School District
Standard status
Active
Size
4,528 SF
Lot size
1.62 Acres
Utilities
Heating system
Steam, Natural Gas
Water source
Public
Amenities
waterfront
open backyard
2-car garage
river access
attic space
Building Details
Year built
1882
Floors in Building
3
Number of units
4
Building materials
Wood Frame, Vinyl Exterior
Roof type
Shingle
Architectural style
Other
Listing Agency:
RE/MAX Shoreline · RE/MAX International
(603) 431-1111
Listed By:
Andy Yau · License #074320
(603) 969-6216
Added: Apr 14, 2025
Changed: Sep 29
Last Checked: Oct 6 at 10:06PM
MLS# 5036194
Copyright © 2026 PrimeMLS. All rights reserved. All information provided by the listing agent/broker is deemed reliable but is not guaranteed and should be independently verified.
Investment Insights
Based on property information with market context.
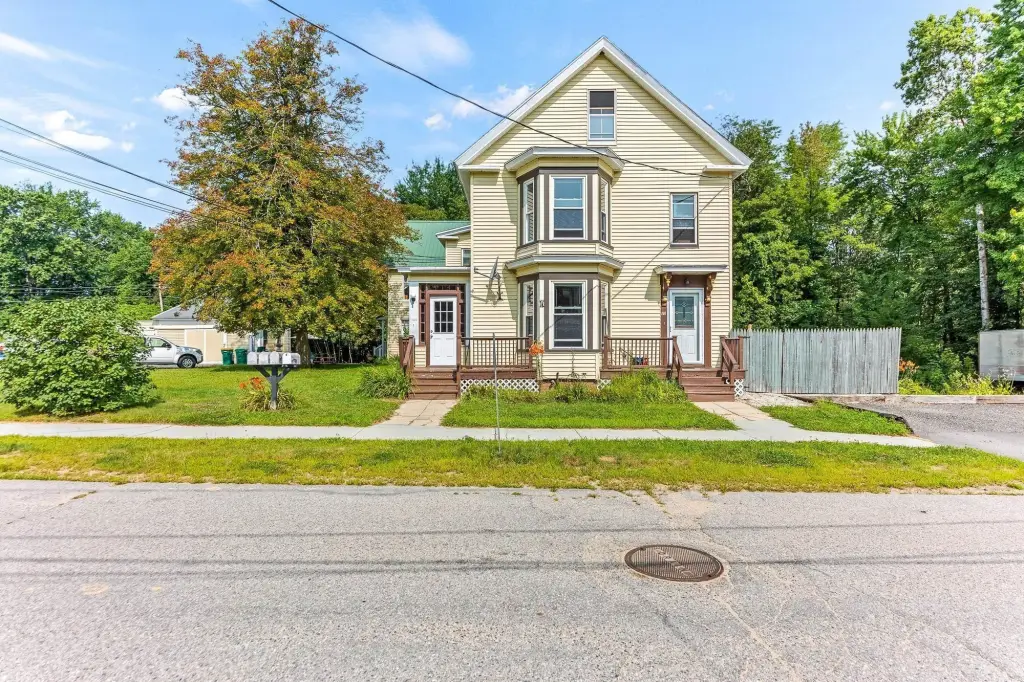
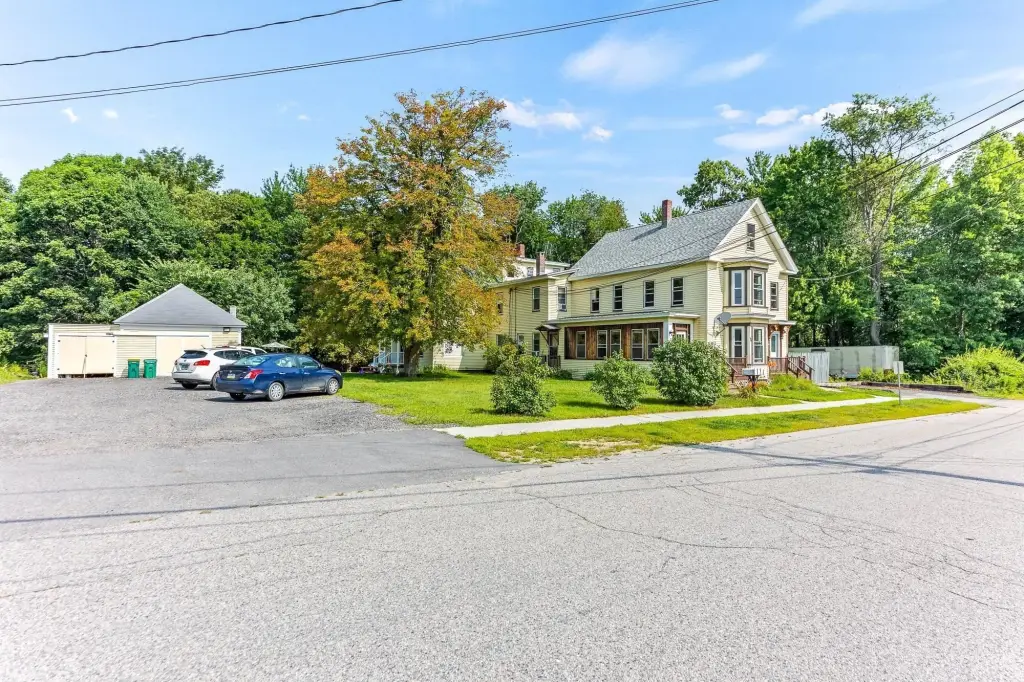
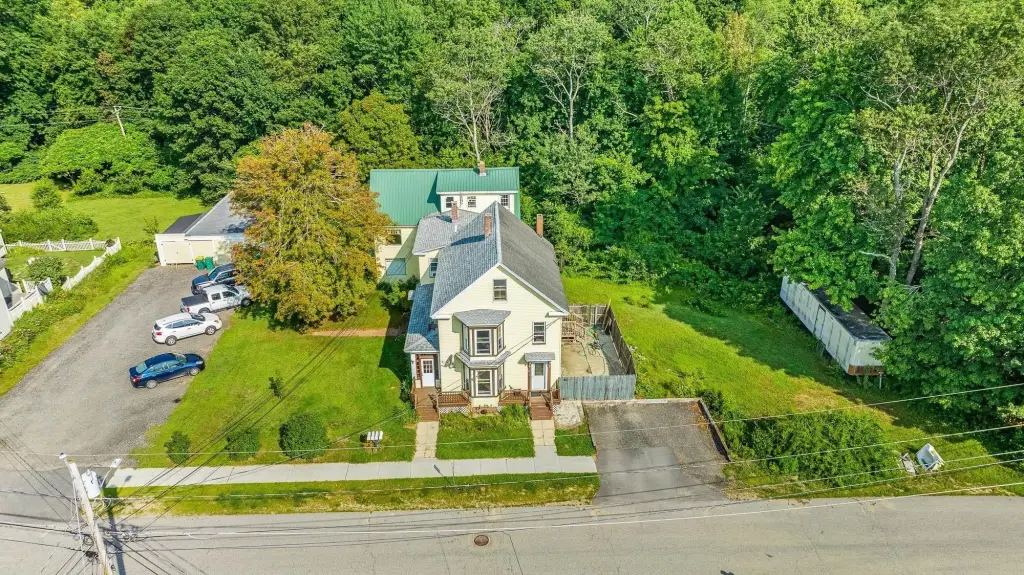
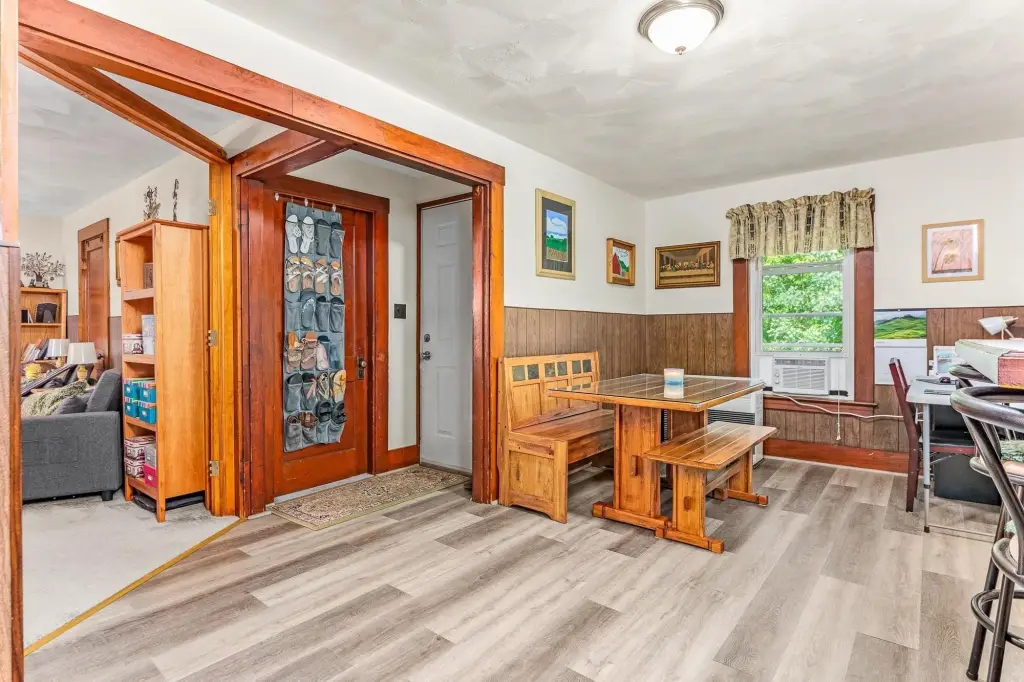
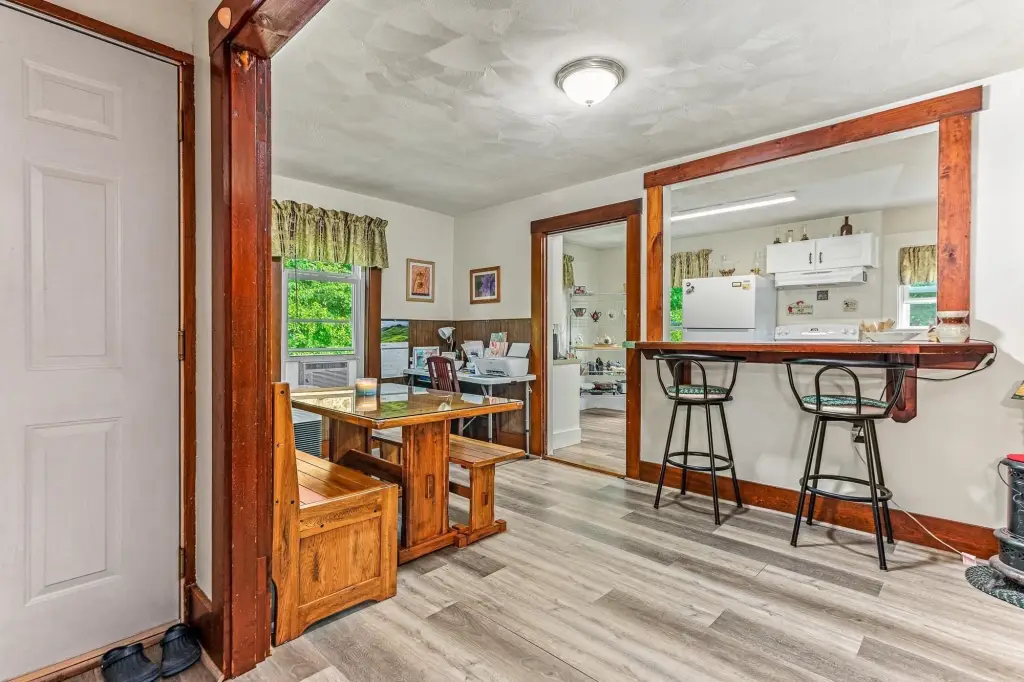
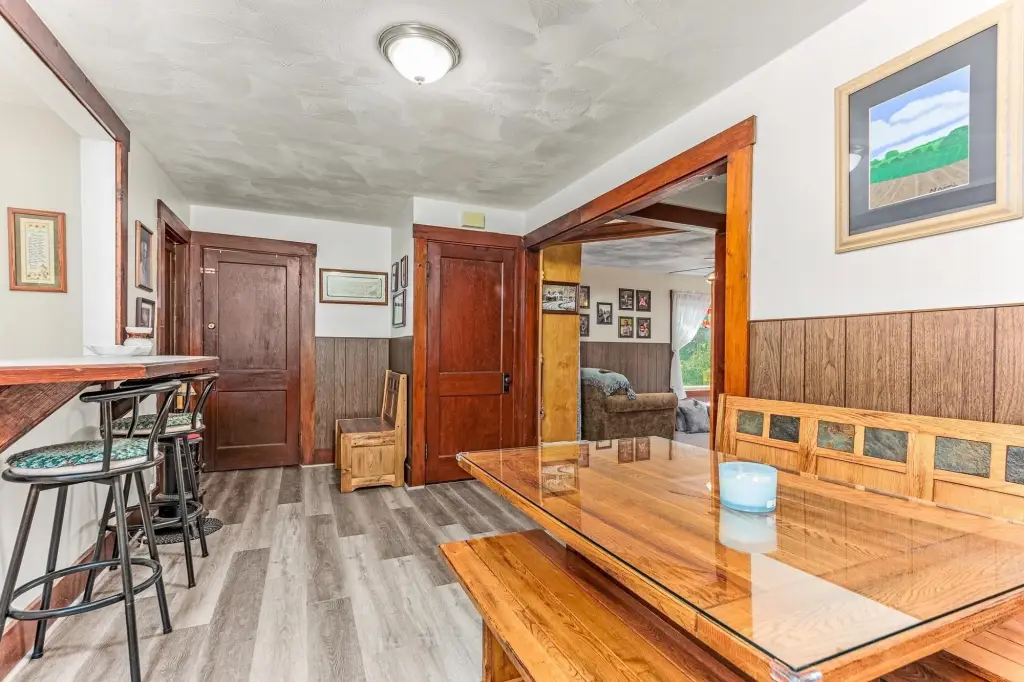
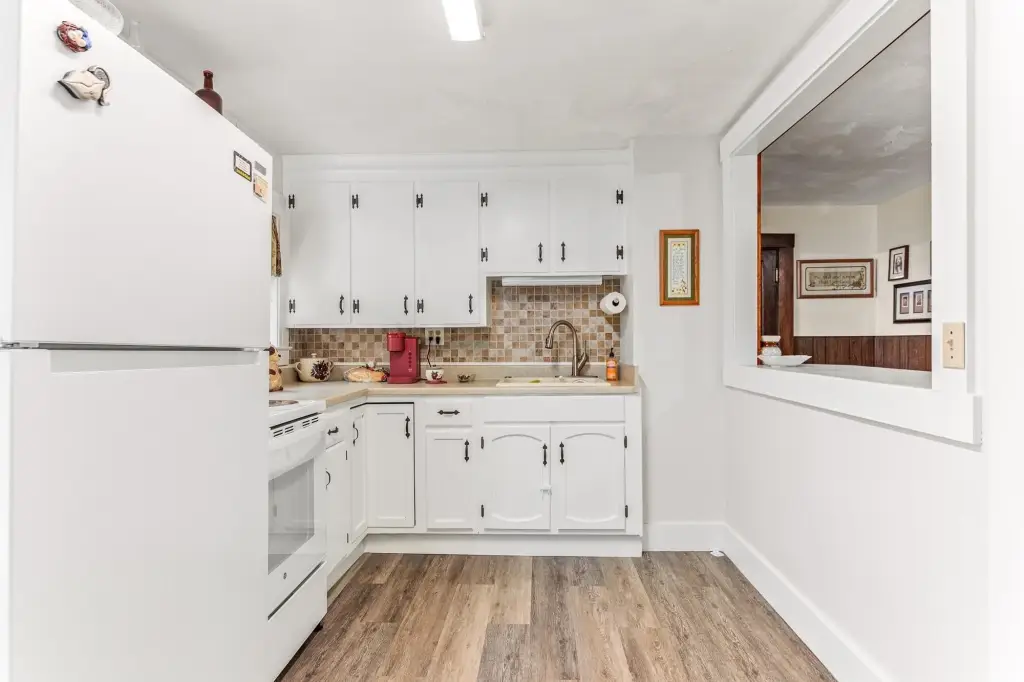
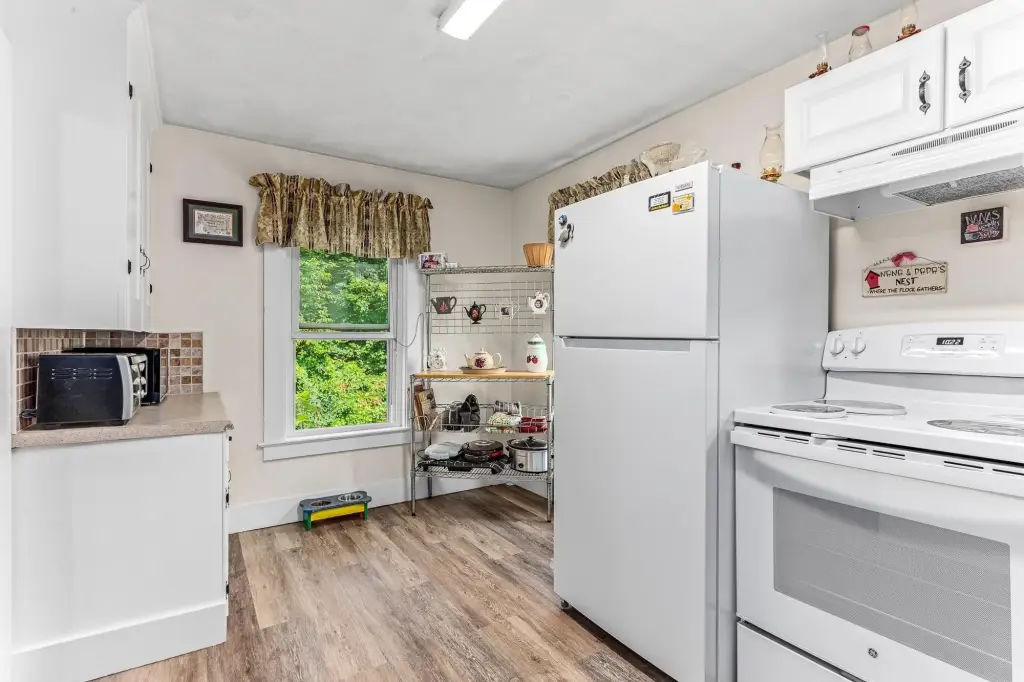
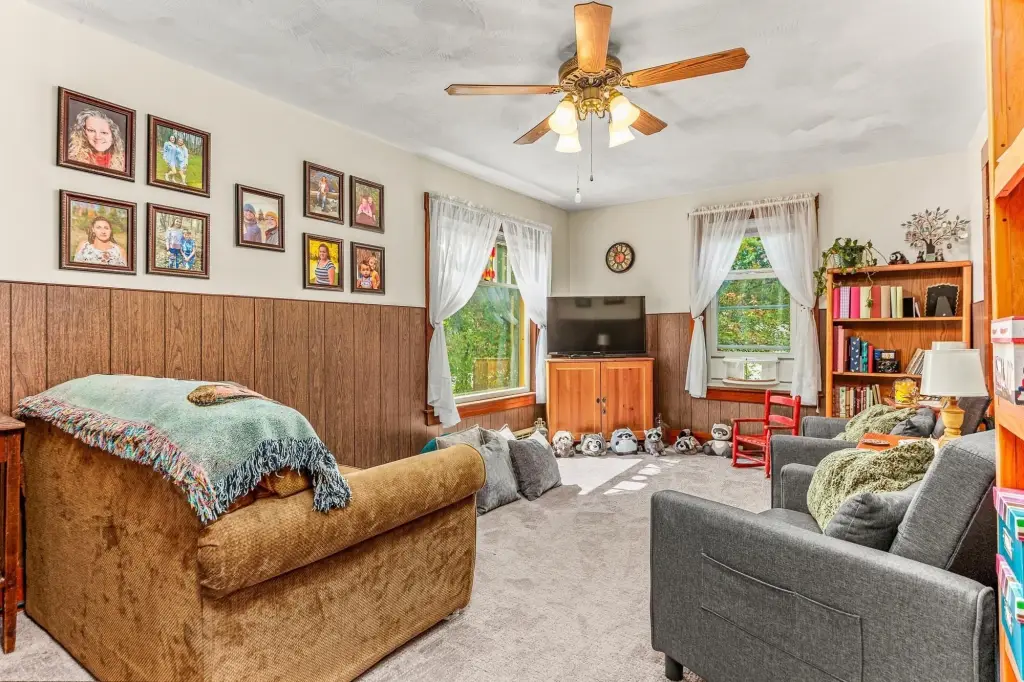
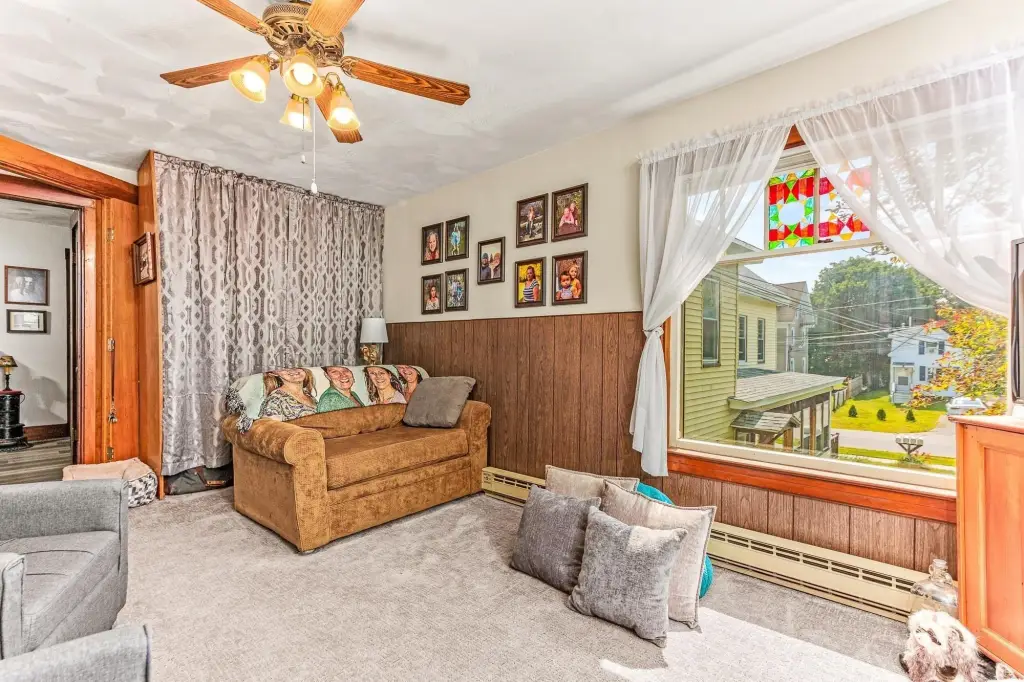
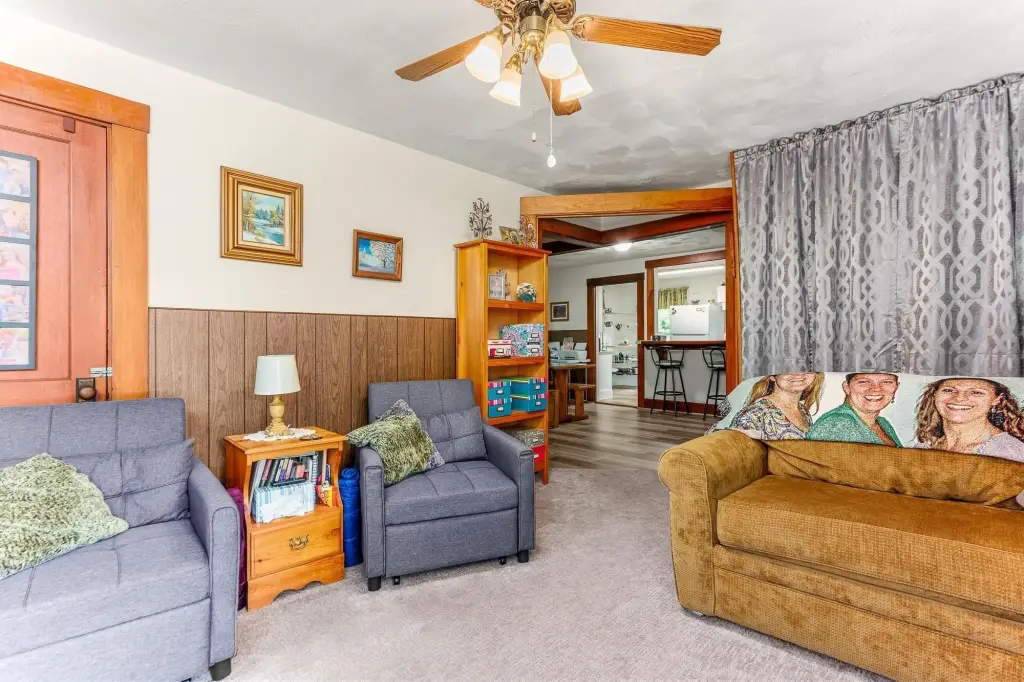
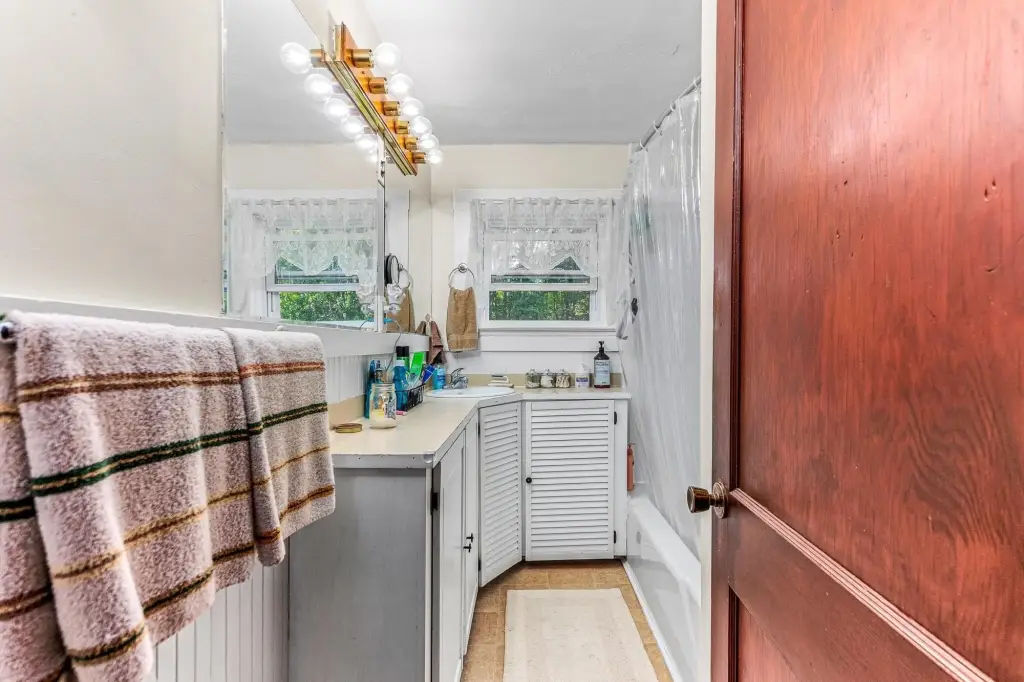
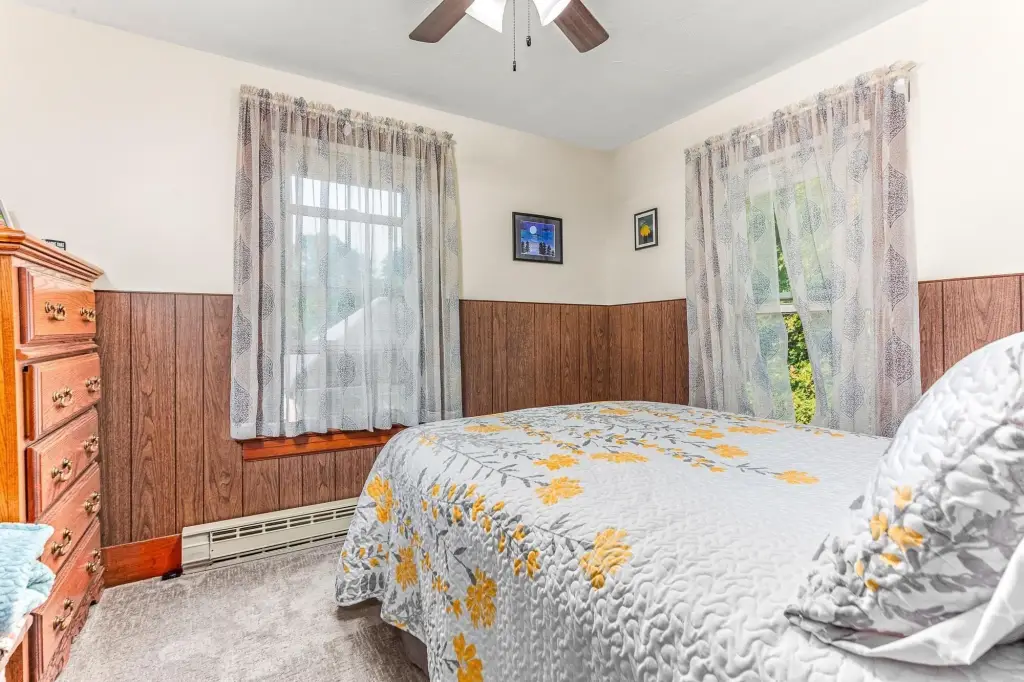
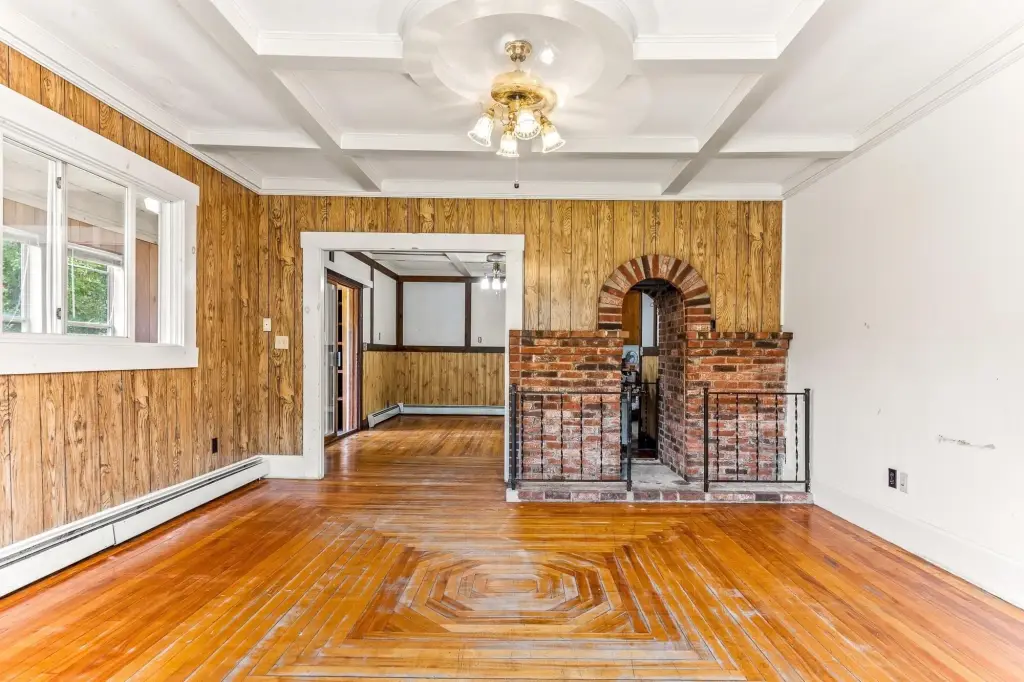
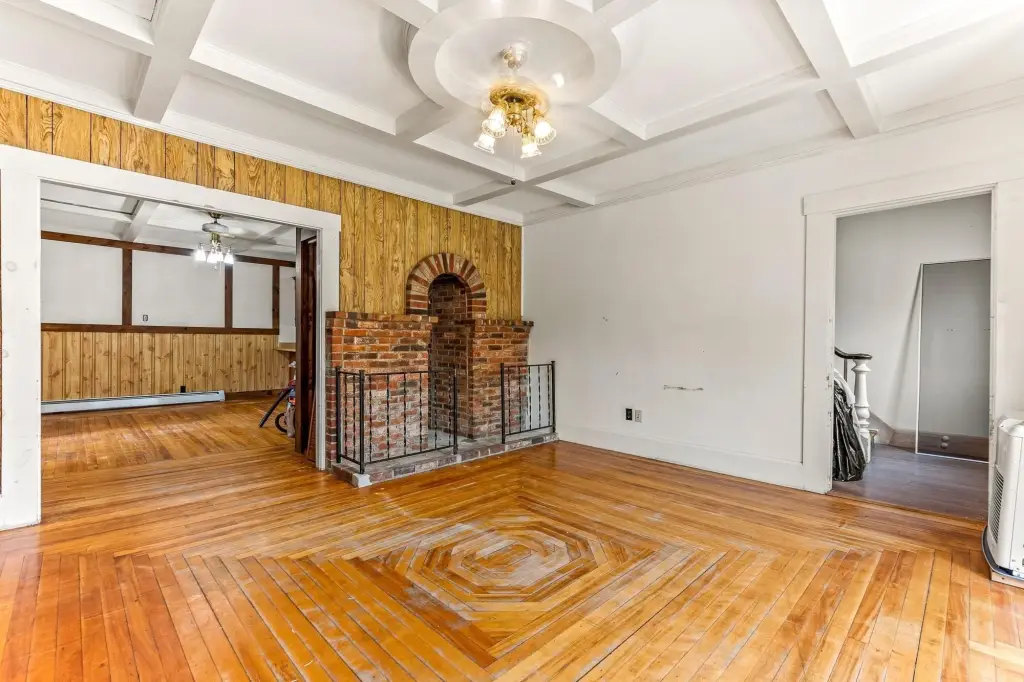
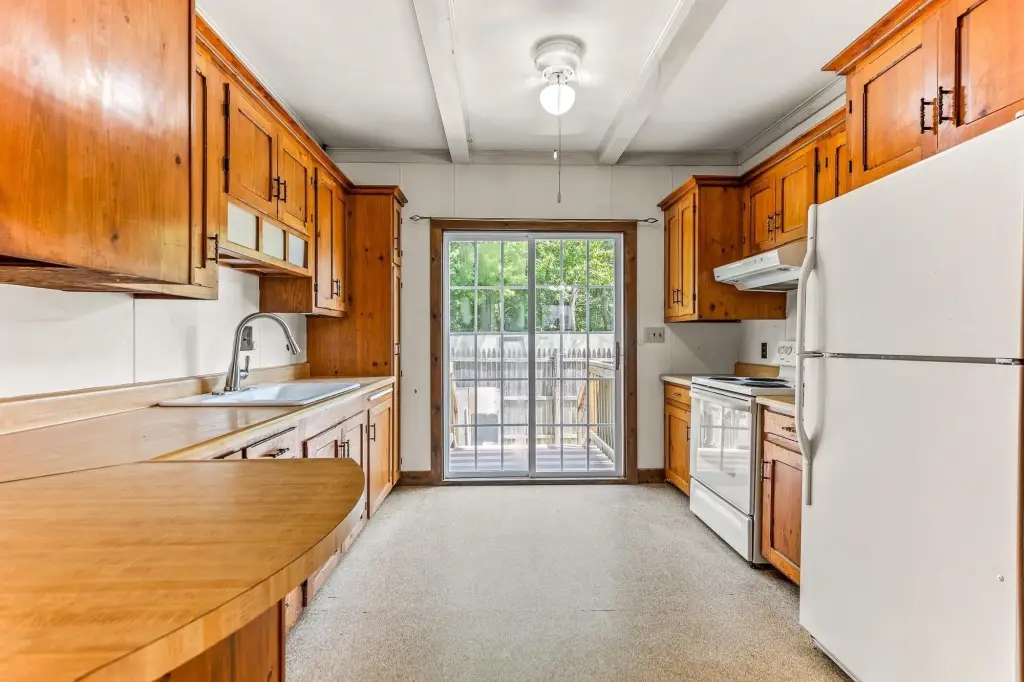
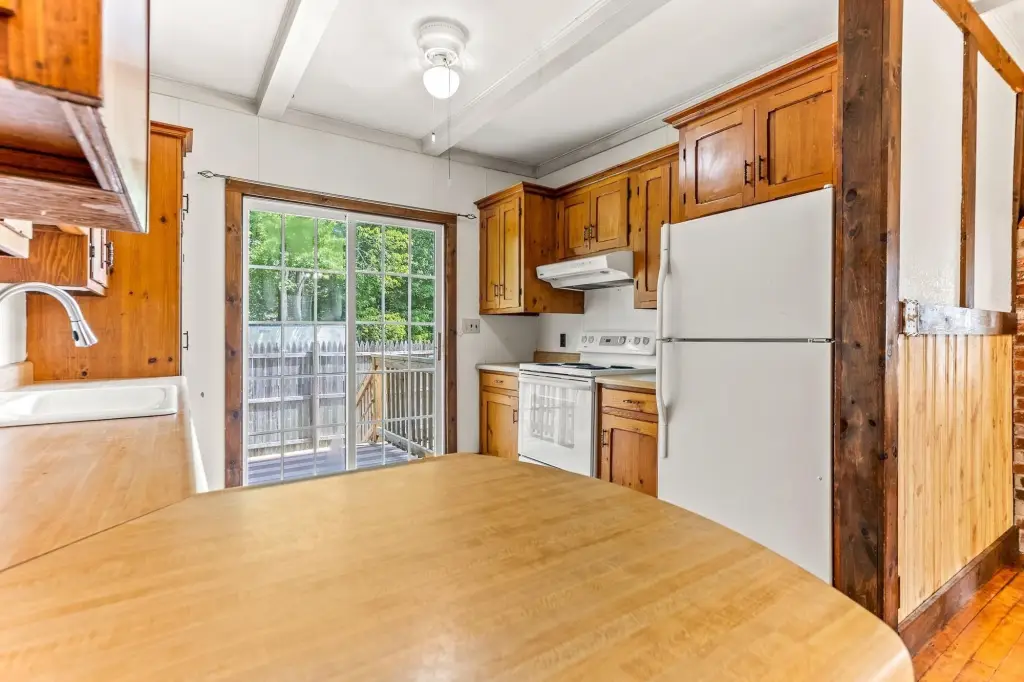
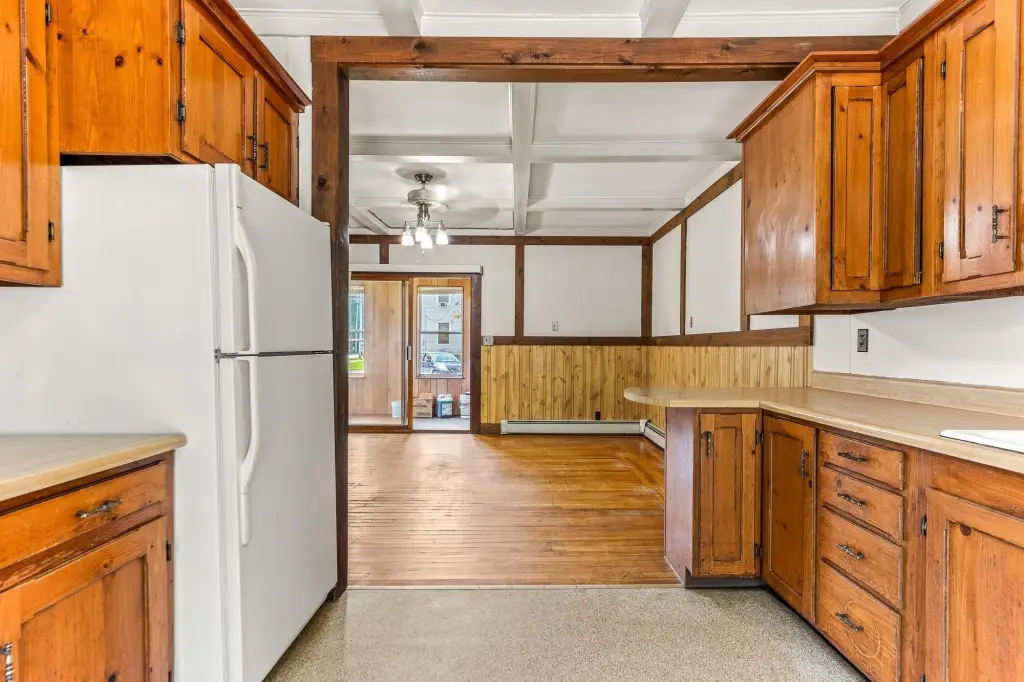
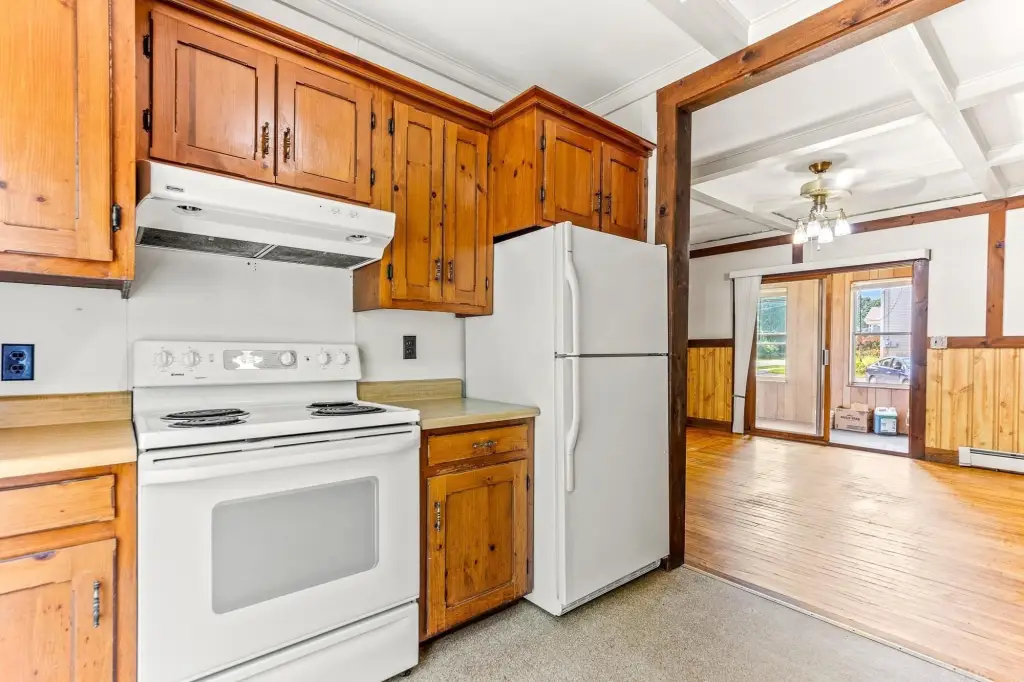
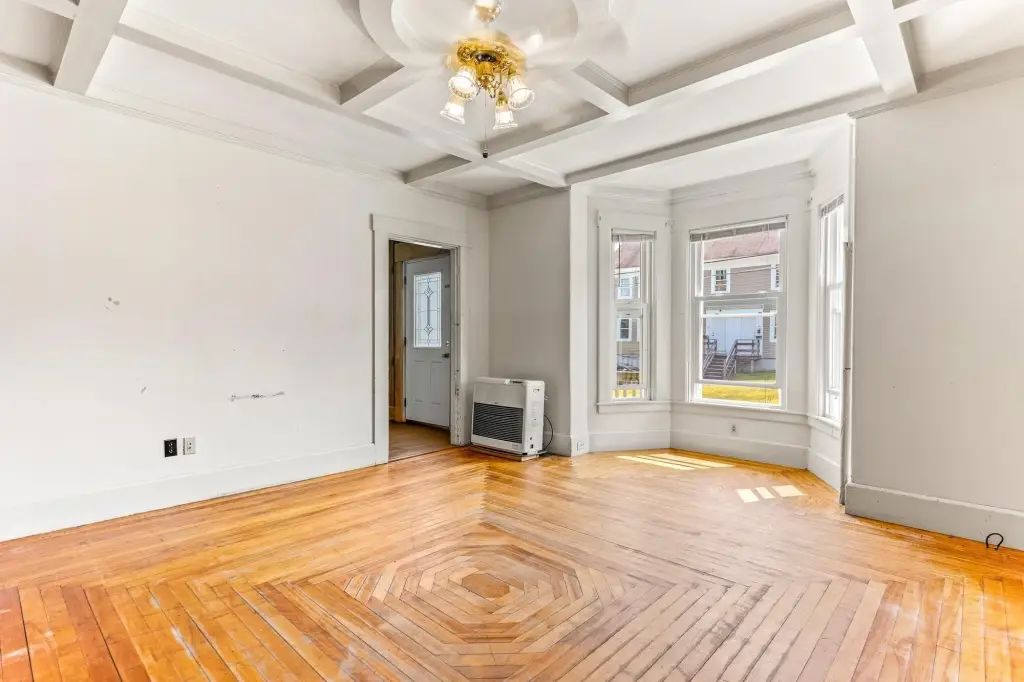
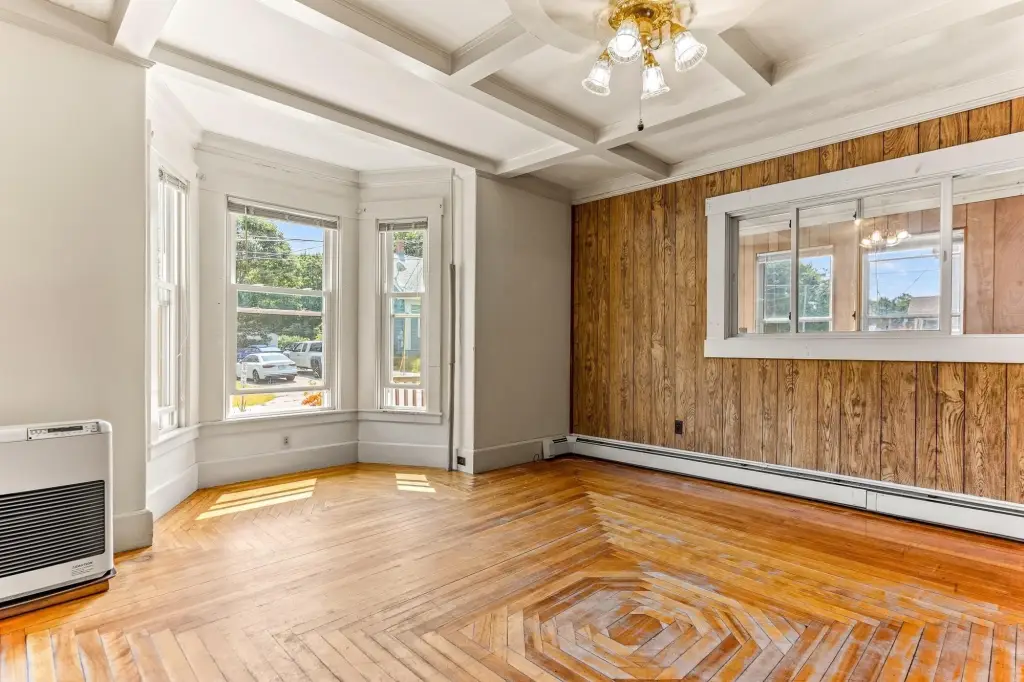
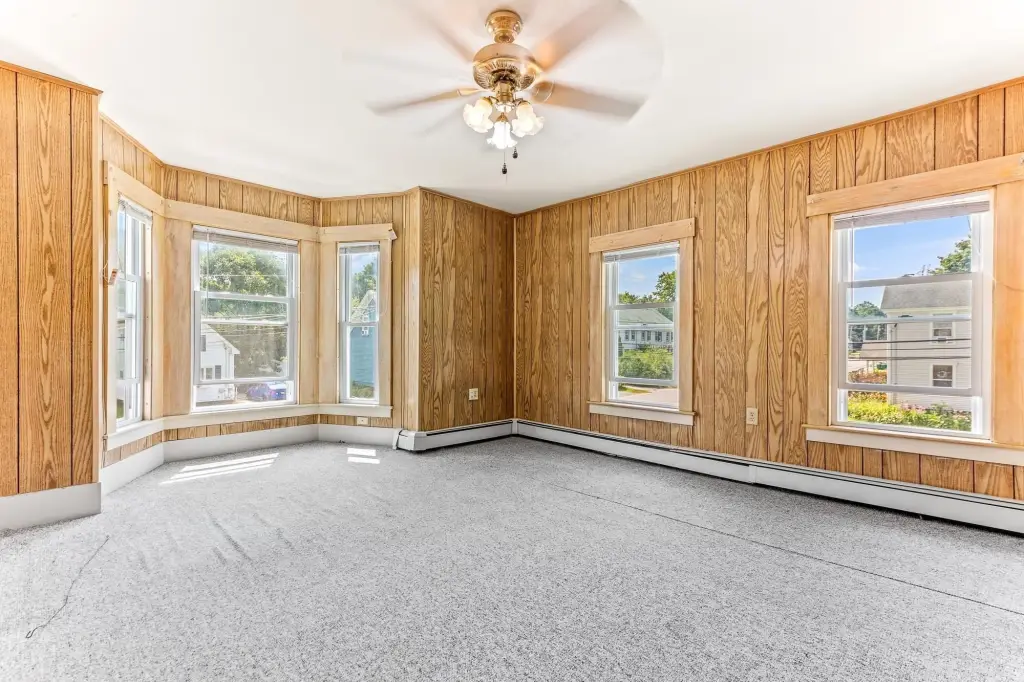
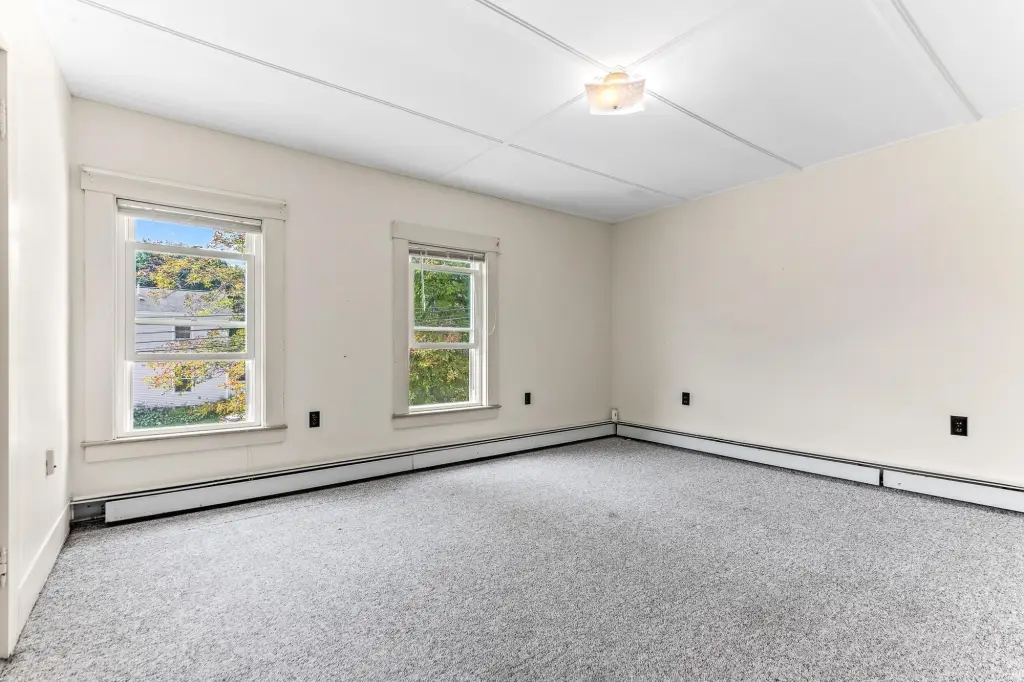
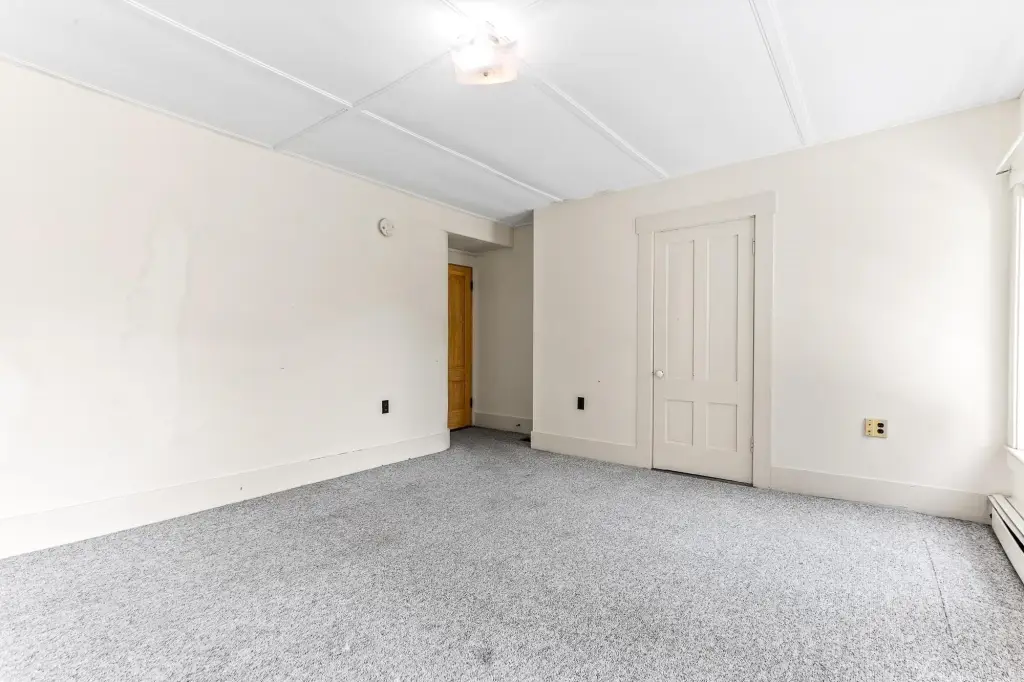
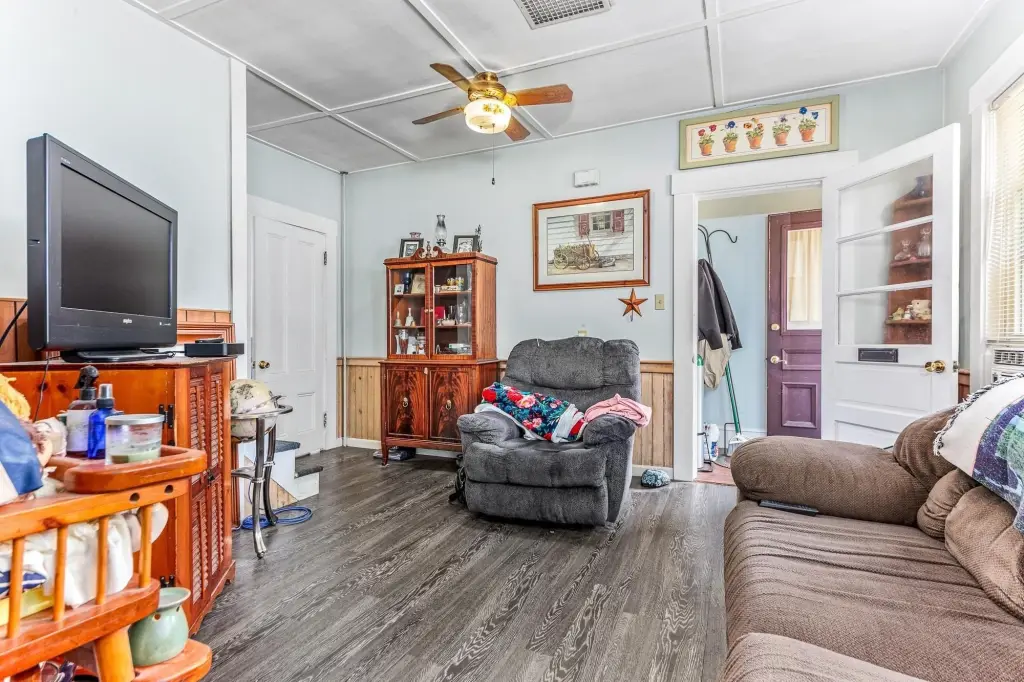
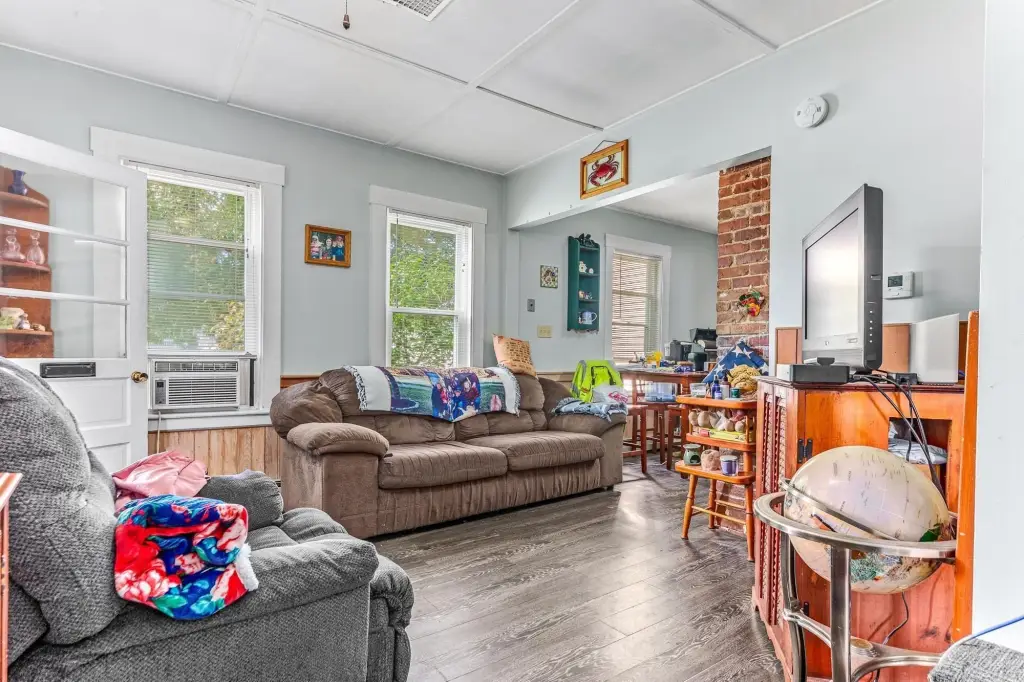
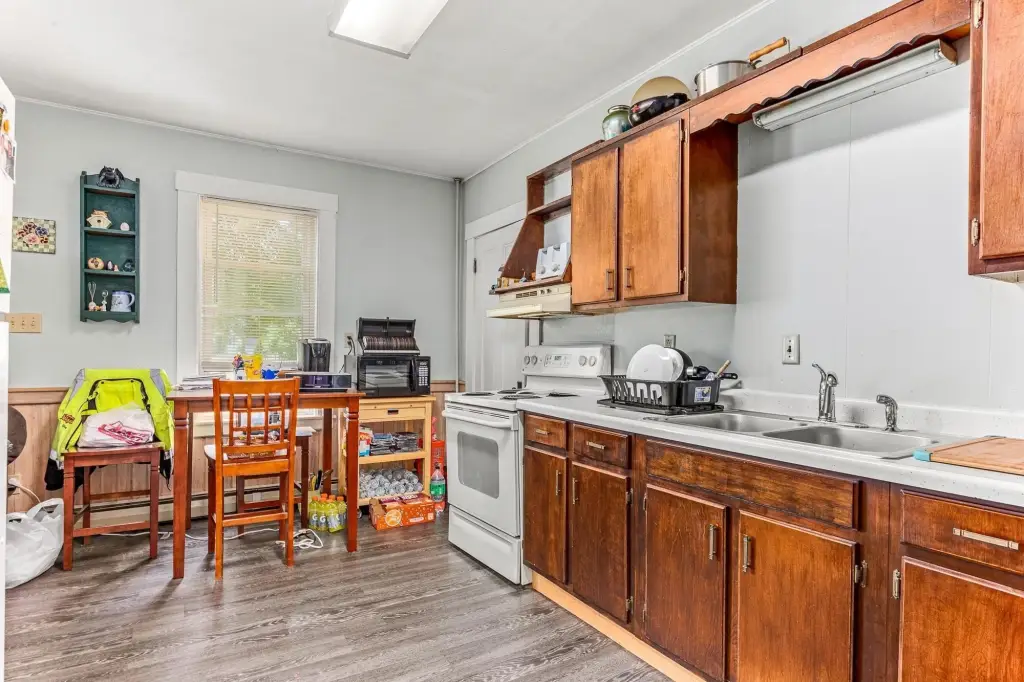
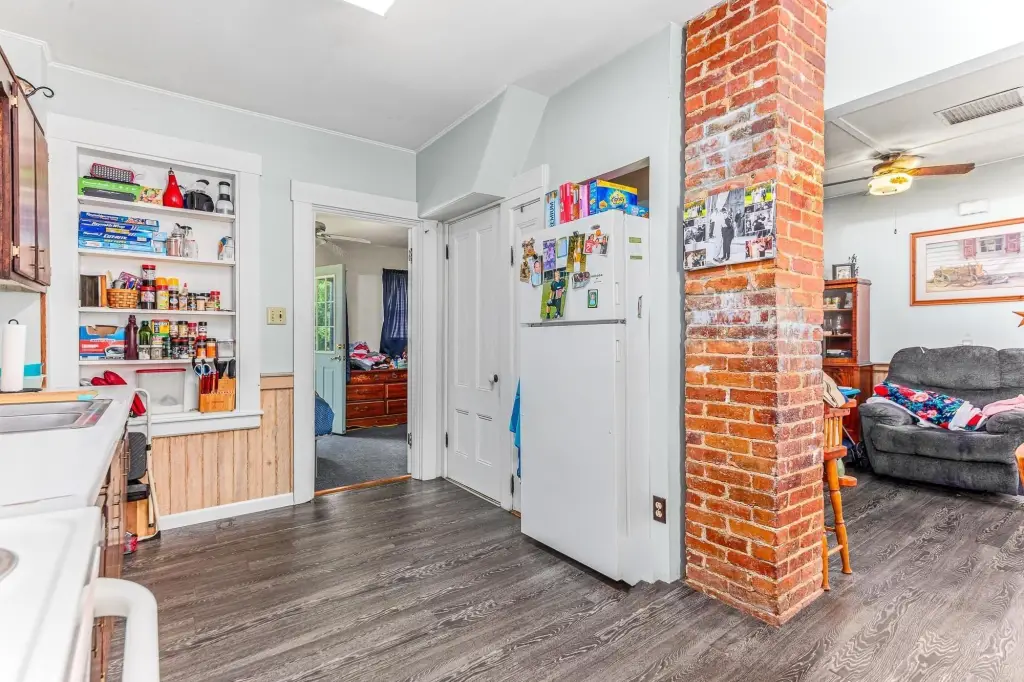
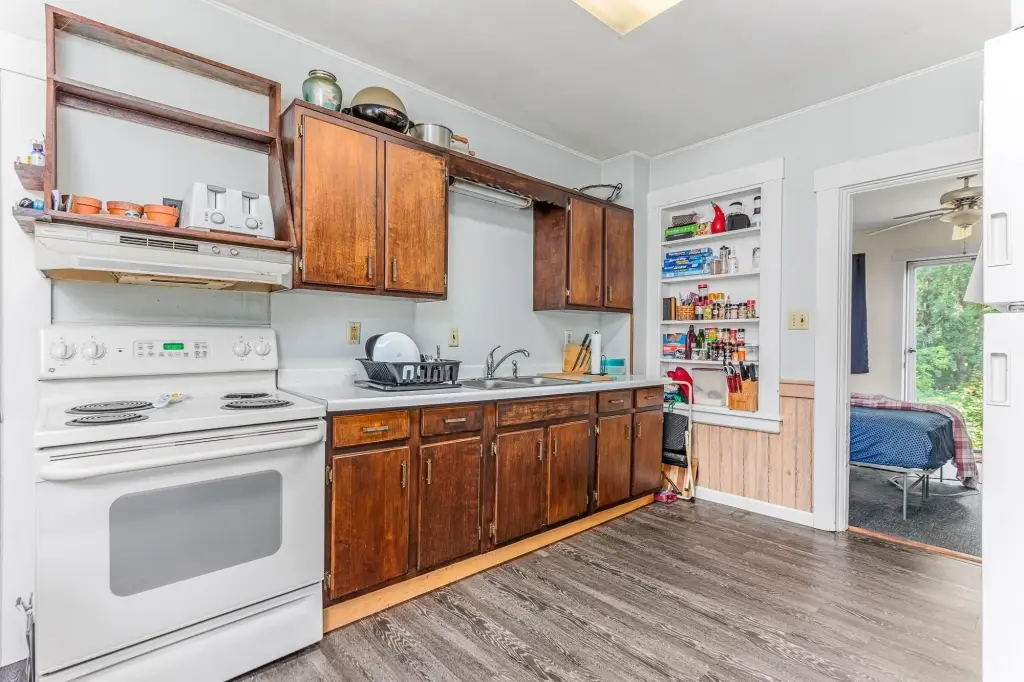
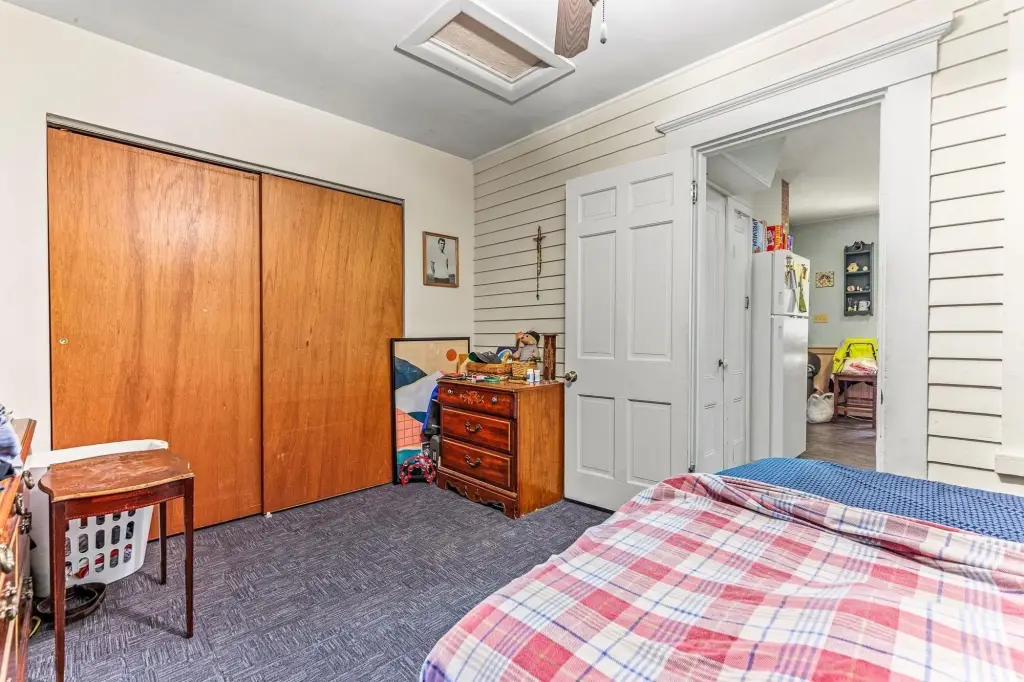
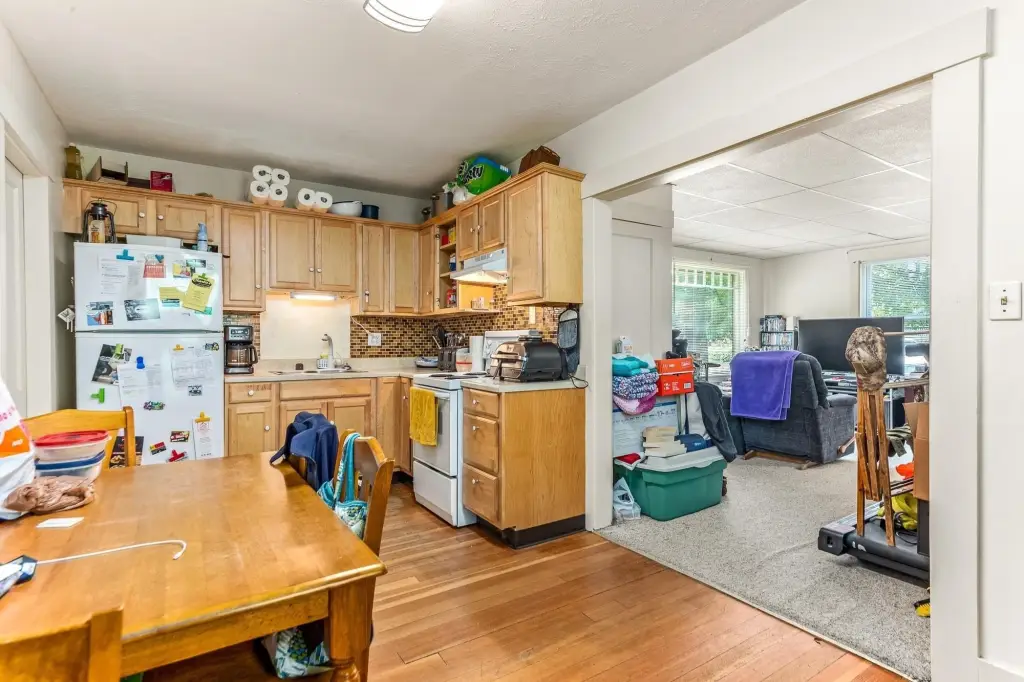
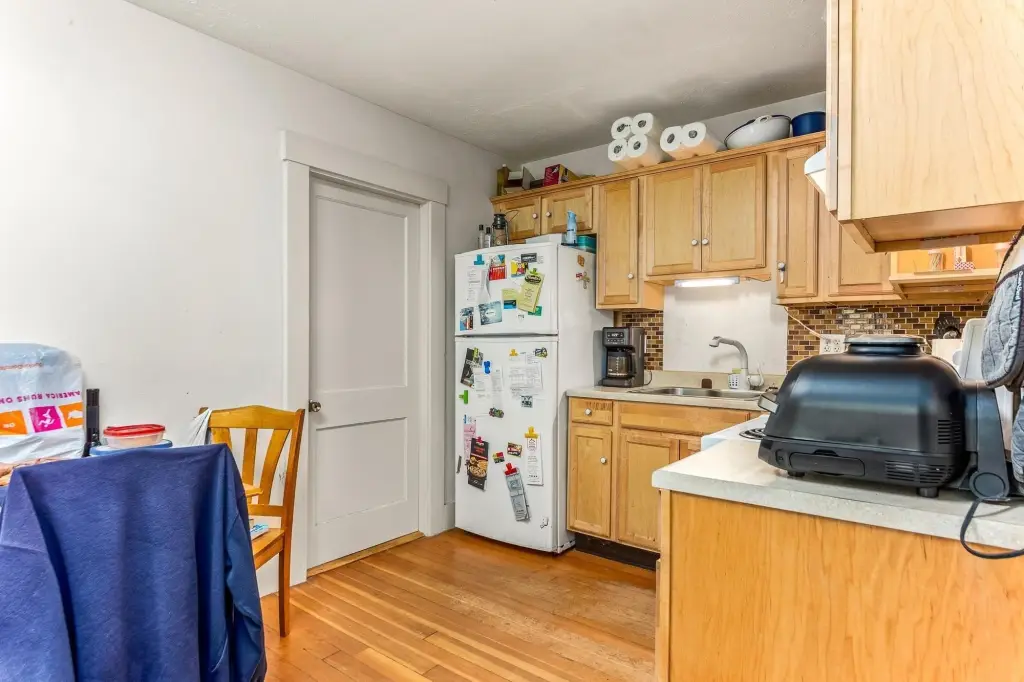
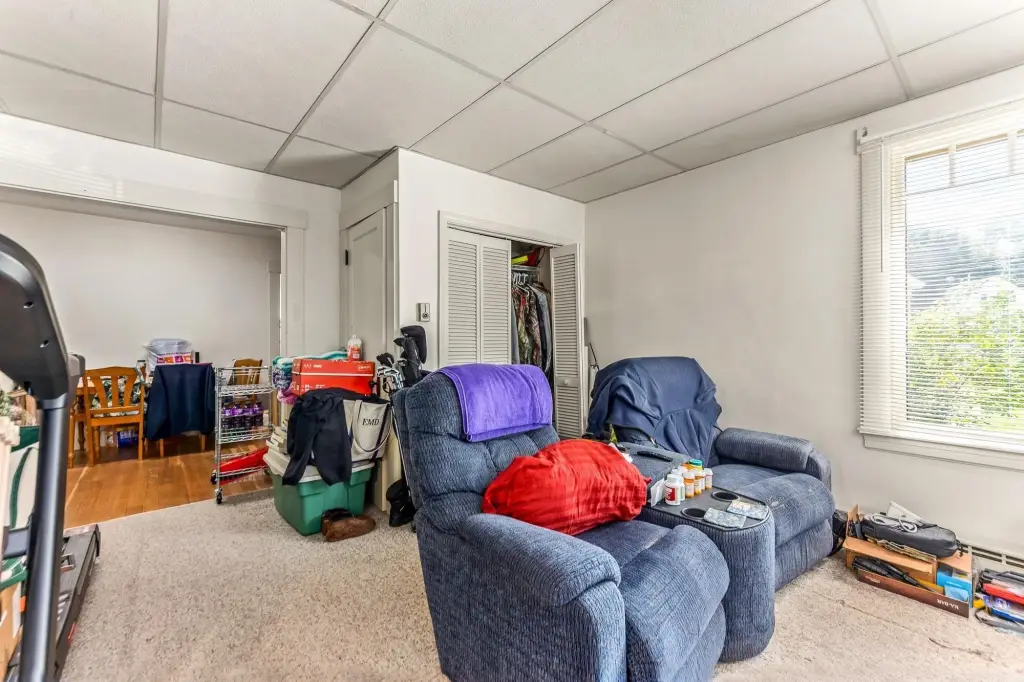
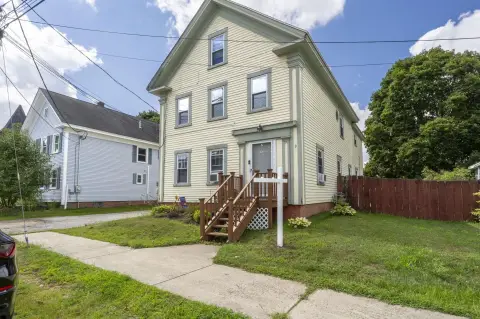
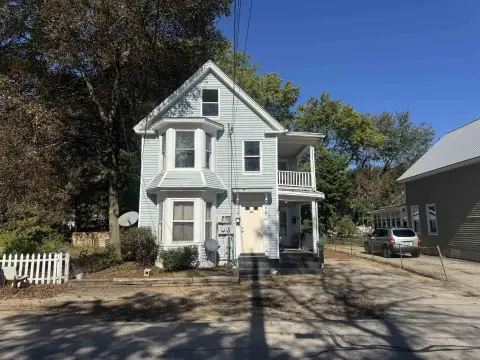
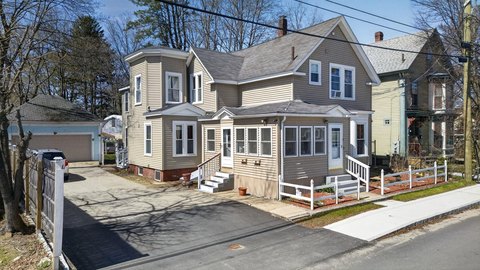
This quadplex contains 4,528 square feet of residential space across four units on a 1.62-acre parcel. Unit layouts include living and dining areas, substantial kitchens, and multiple bedrooms. Interior details vary by unit and include hardwood flooring, crown molding, wood trim, luxury vinyl flooring, kitchen backsplash treatments, and an open kitchen arrangement. The property also includes attic storage or expansion space, a basement, a 2-car garage, and additional parking. Construction dates to 1882, with wood-frame construction, a vinyl exterior, shingle roofing, steam heat, natural gas, and public water.
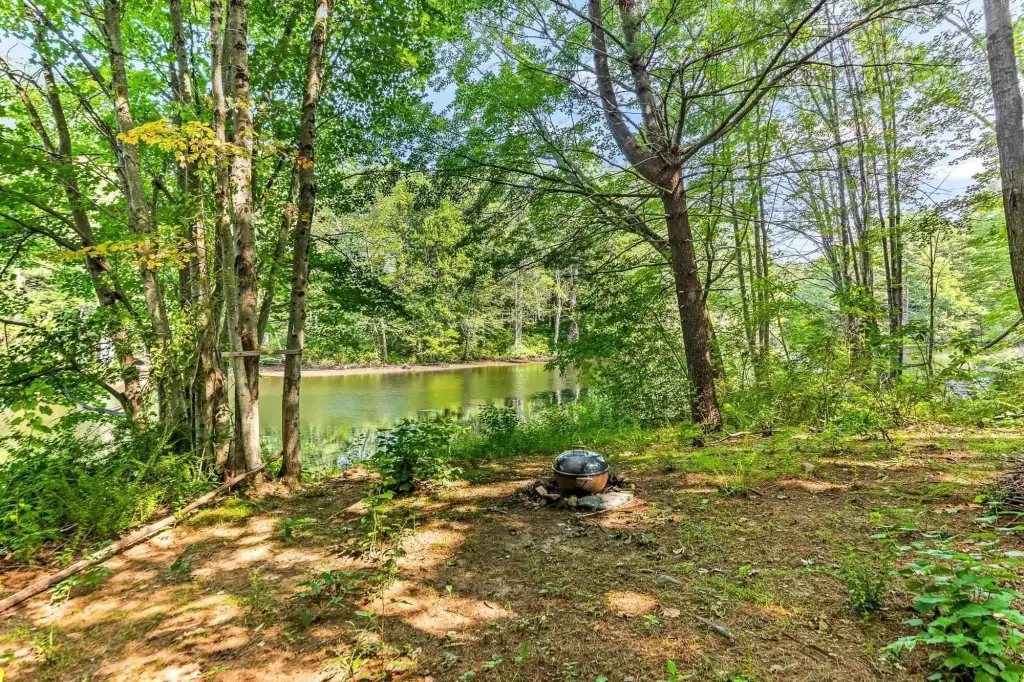
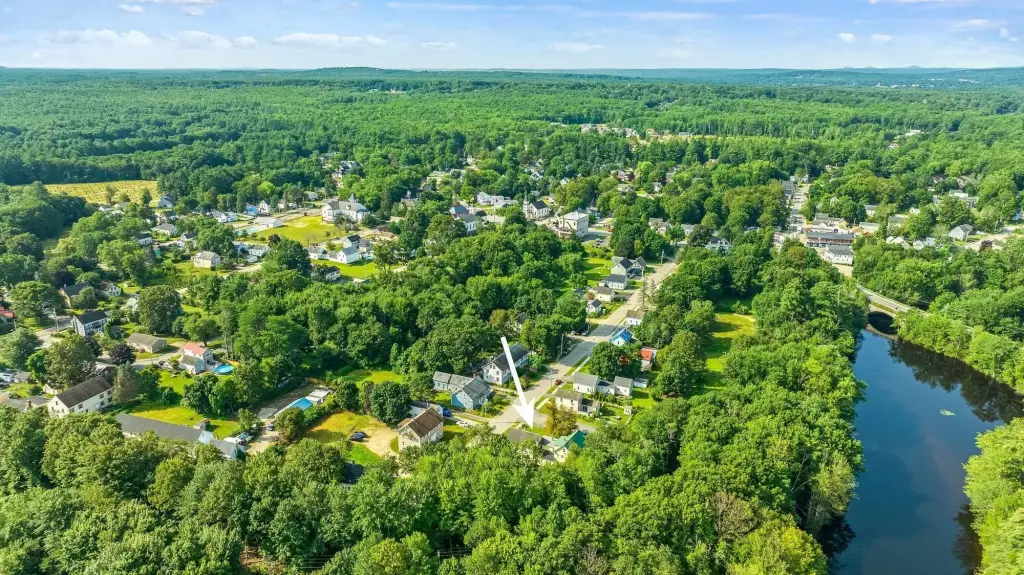
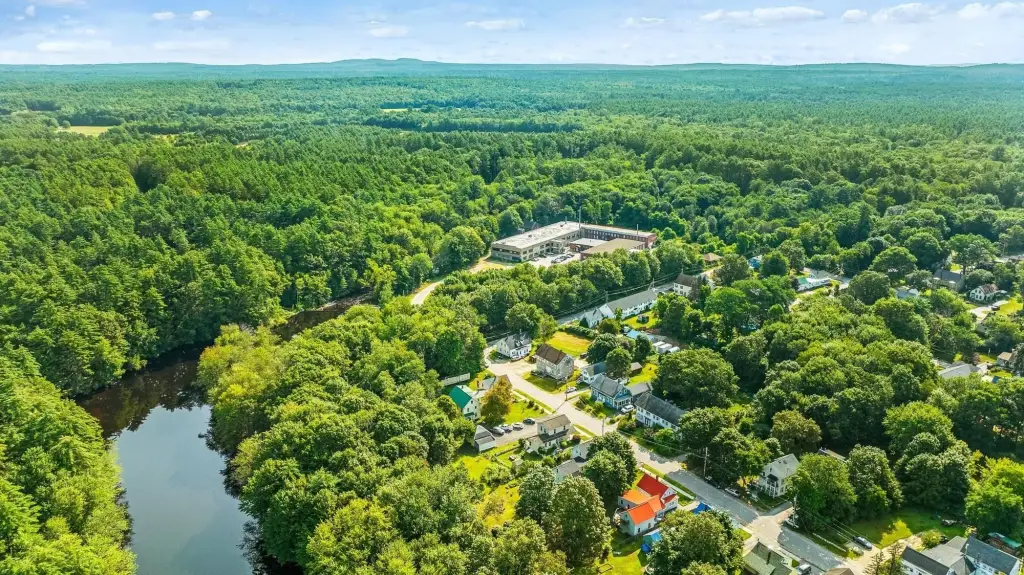
The property fronts the Salmon River, providing direct water access from the homes. It is 1.5 miles from downtown Rochester, 3 miles from Route 16, and 20 miles from Portsmouth. R2 zoning is in place, and the source information indicates that additional units may be possible with a special exception. Separate utilities serve the existing units.
The property fronts the Salmon River, providing direct water access from the homes. It is 1.5 miles from downtown Rochester, 3 miles from Route 16, and 20 miles from Portsmouth. R2 zoning is in place, and the source information indicates that additional units may be possible with a special exception. Separate utilities serve the existing units.
Key Highlights
- 4,528 square feet of residential space across a quadplex
- 1.62‑acre waterfront parcel with direct access to the Salmon River
- R2 zoning with potential for additional units by special exception
Financial Insights
Estimated NOI and Cap Rate
NOI / Yr
$45,966
Cap Rate
5.11%
Suggested Prices Based on Cap Rates
Cap Rate 5%
$919,320
$919.3K
Cap Rate 7%
$656,657
$656.7K
Cap Rate 9%
$510,733
$510.7K
Market Conditions
NOI Build-Up for 4,528 SF
Gross rent
$67.9K $15.00/SF
− Vacancy
−$2.3K −$0.50/SF
EGI
$65.7K $14.50/SF
− OpEx
−$19.7K −$4.35/SF
NOI
$46.0K $10.15/SF
Area
Strafford County, NH
Vacancy
3.32%
Lease Rate
$15.00 /SF/Yr
Expense Ratio
30.00%
Simulate Cap Rate and NOI
Suggested Prices Based on Cap Rates
Cap Rate 5%
$919,320
Cap Rate 7%
$656,657
Cap Rate 9%
$510,733
Alternative Uses
Best Use
Multifamily LT 5
$656.7K
$574.6K – $766.1K
NOI $45,966 @ 7.0% cap · market cap 5.11%
Second Best
Apartment 5plus
$605.6K
$529.9K – $706.6K
NOI $42,393 @ 7.0% cap · market cap 4.72%
Theoretical Best
Office A
$1.21M
$1.06M – $1.41M
NOI $84,797 @ 7.0% cap · market cap 9.43%
Zoning and permitted uses should be independently verified with authorities.
Property Analytics
Unlock full access to Insights
Subscribe to Realmo Intelligence
Open Analytics
Current Use
Lease Details
4
Residential units
Yes
Highway access
Location Intelligence
Trade Area within ½ mile
98
Businesses Nearby
Explore this area
Business Placement
Demographics for 03867, NH
22,369
Population
10,458
Households
2.1
Avg Household Size
44
Median Age
25%
College-Educated
93%
High-School Grad
28.4 sq mi
ZIP Area
788
Density / Sq Mi
$74,397
Median Household Income
$42,613
Median Earnings
$1,217
Median Rent
$259,200
Median Home Value
Check the figures for this property
Cap Rate, Value Estimation, Potential NOI and more
View Realmo Analytics
Market
Vacancy Rate% for Multifamily in Northeast region

Questions? Ask Rey
Realmo’s AI knows this listing — price, zoning, demand, history. Ask anything.



Frequently Asked Questions
What type of property is this?
Quadplex - Four residential units offer spacious layouts, separate utilities, and direct access to the Salmon River.
Where is this quadplex located?
The property is located at 32 Mill Street Rochester, NH.
What is the asking price?
The asking price for this property is $899,000.
What are key features of this property?
This property features: 4,528 square feet of residential space across a quadplex; 1.62‑acre waterfront parcel with direct access to the Salmon River; R2 zoning with potential for additional units by special exception



