4655 BENSON Street, Philadelphia, PA 19136
MULTI_FAMILY - Other - PHILADELPHIA, PA
- Added:
- Apr 21, 2026
- Days on Market:
- 68
- Last Refresh:
- Jun 27 at 12:06 pm
Property Features for 4655 BENSON Street
General Information
- Property type
- Residential Multi Family
- Property subtype
- Other
- Rooms
- Basement
- Parking features
- On Street
- Standard status
- Active
- Size
- 2,500 SF
- Lot size
- 0.08 Acres
Taxes and HOA fees
- Tax Annual Amount
- 3086
Utilities
- Heating system
- Forced Air
- Cooling system
- Central Air
Building Details
- Year built
- 1965
- Number of units
- 2
- Building materials
- Masonry
- Architectural style
- Other
Listing agent James Gale License #RS351326 (267) 228-7203
Listing office Realty Mark Cityscape 1500 John F Kennedy Boulevard unit: 1510, Southampton, PA (215) 583-7777
Listing date Apr 21, 2026
Copyright © 2026 Bright MLS. All rights reserved. All information provided by the listing agent/broker is deemed reliable but is not guaranteed and should be independently verified.
HighLights
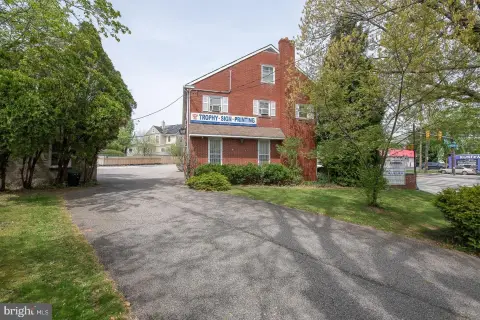
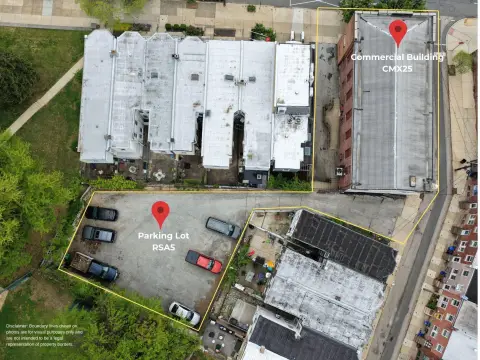
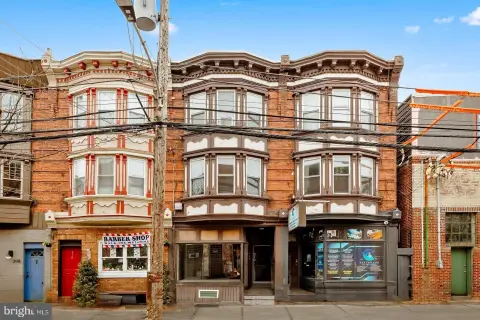
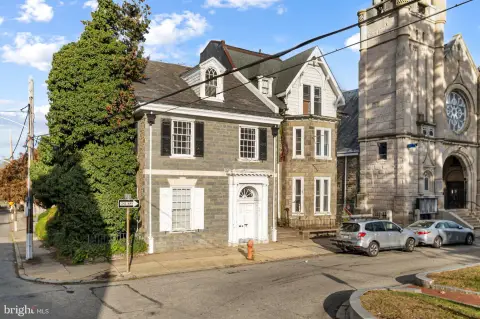
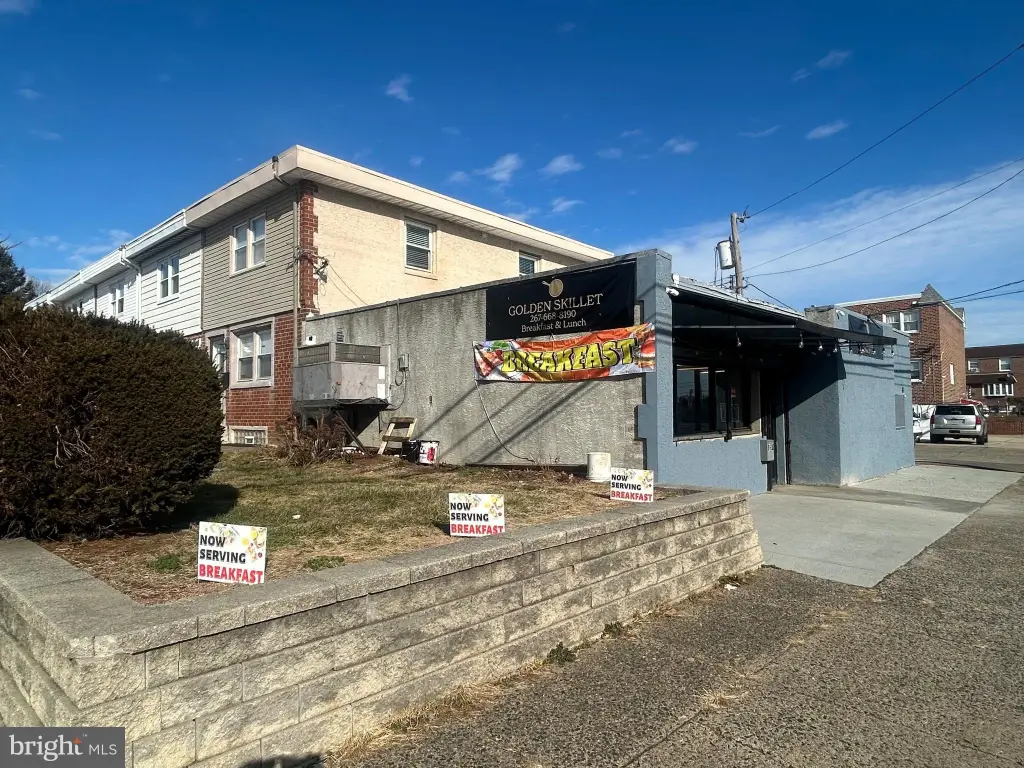
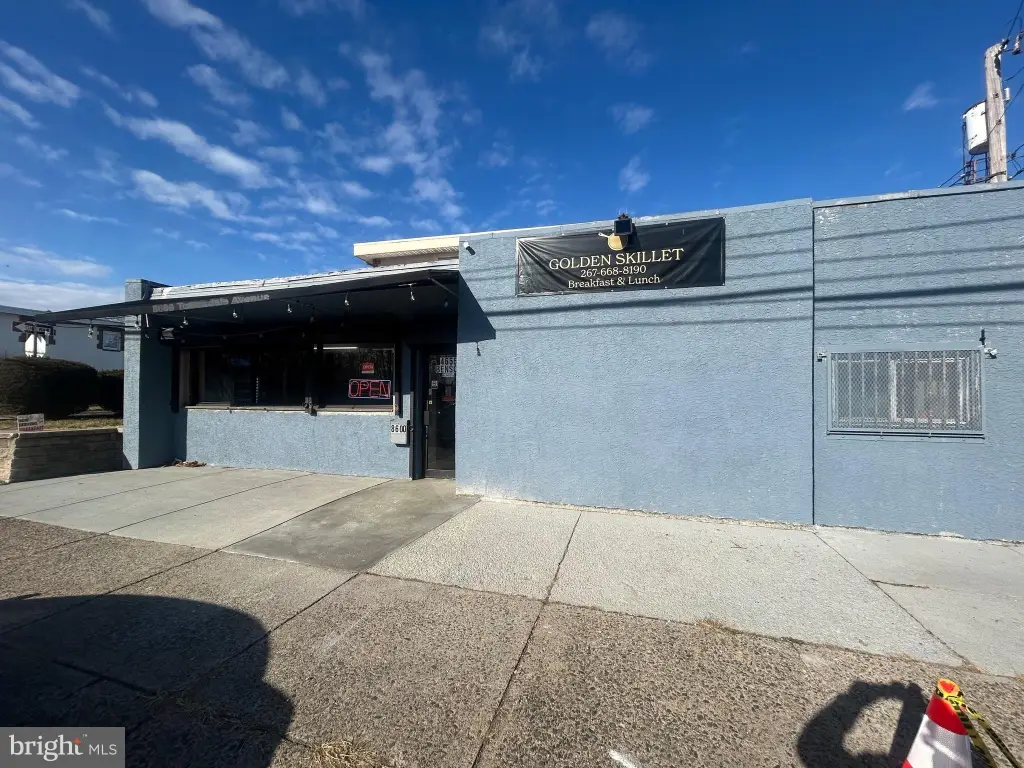
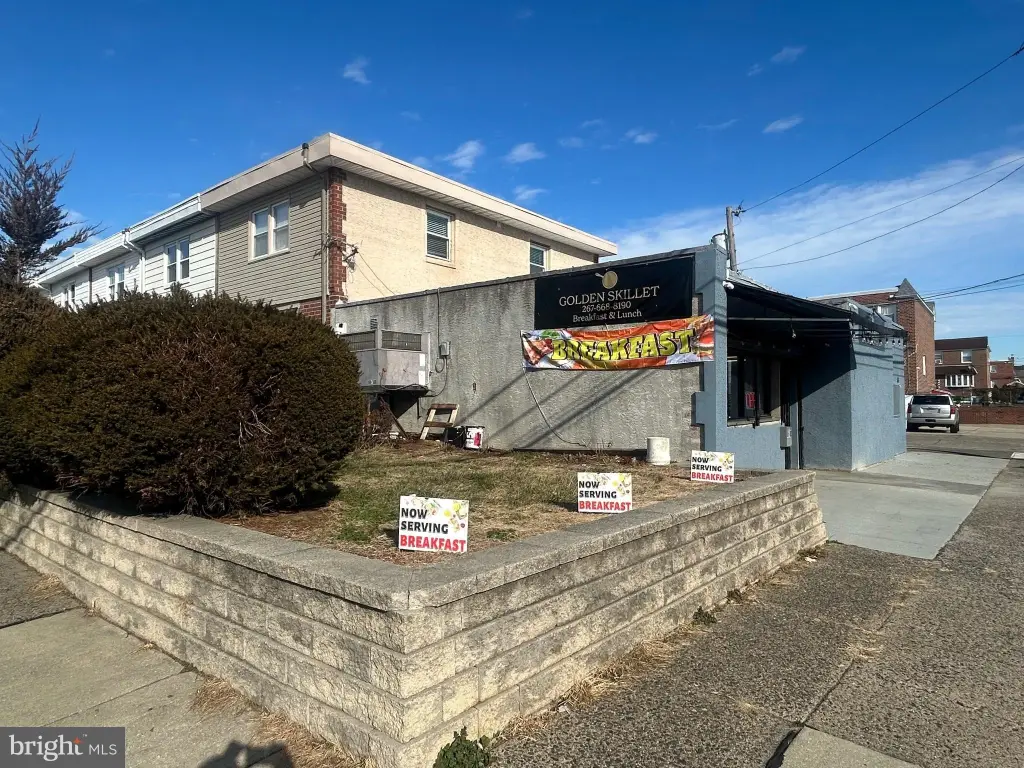
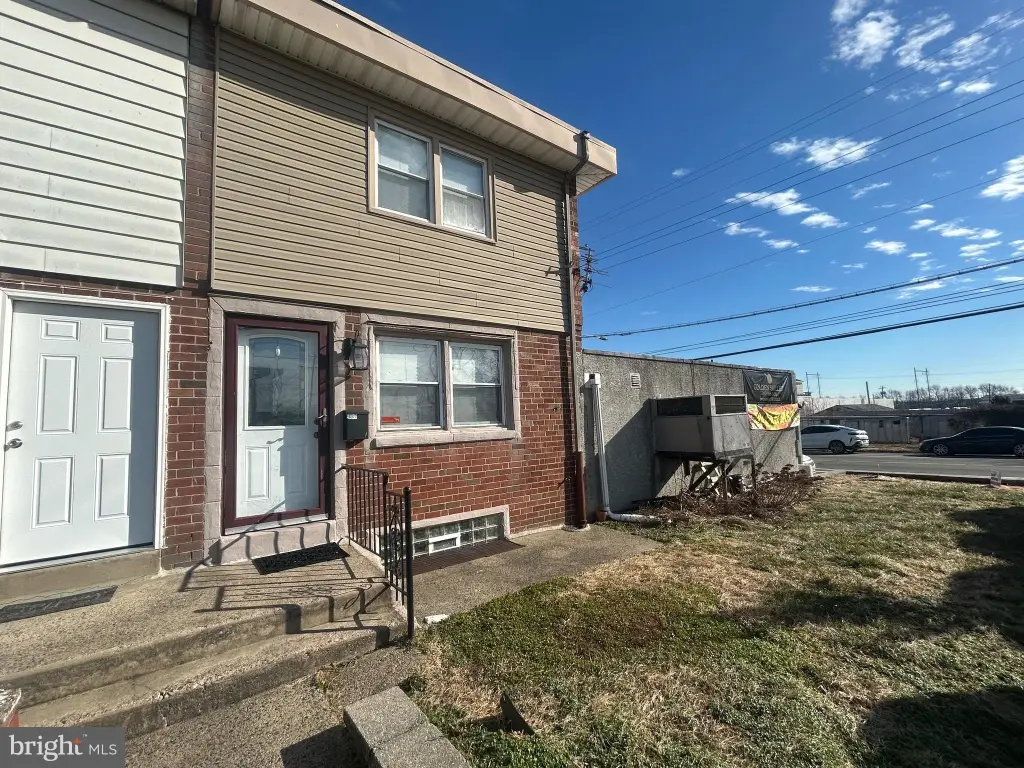
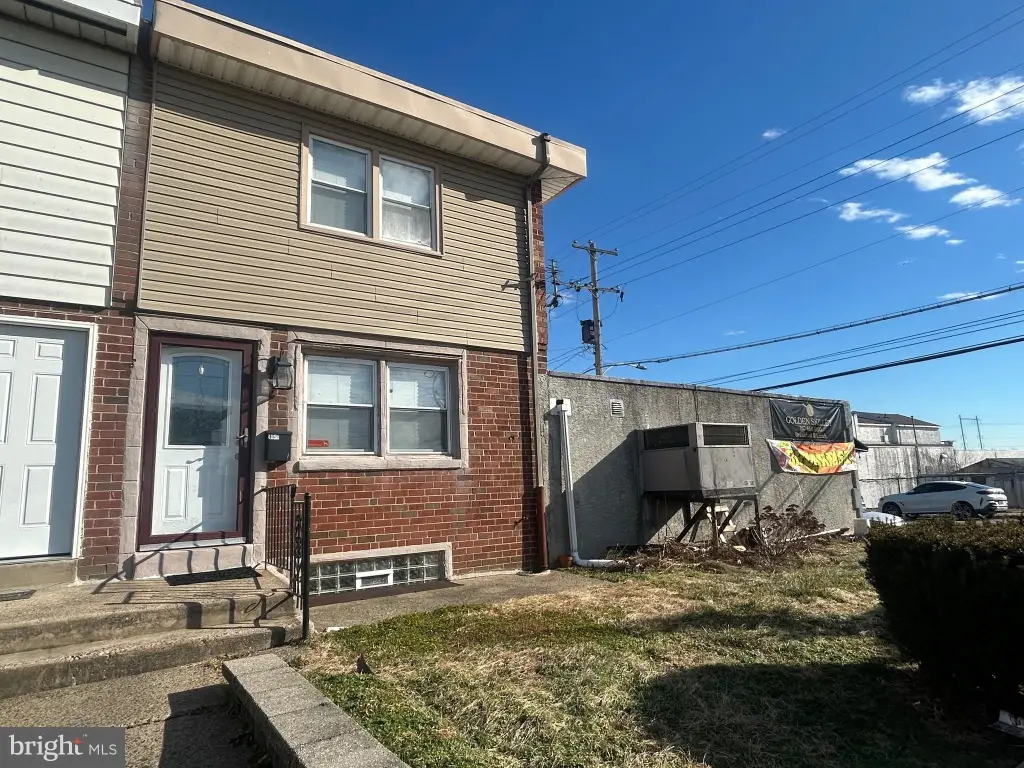
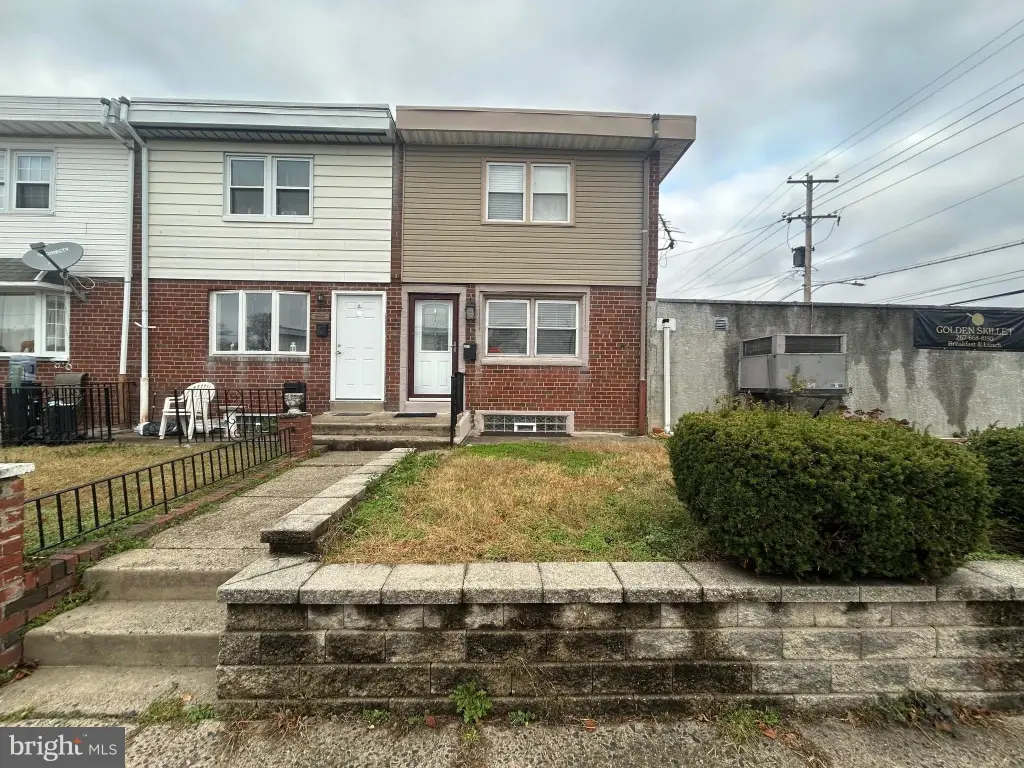
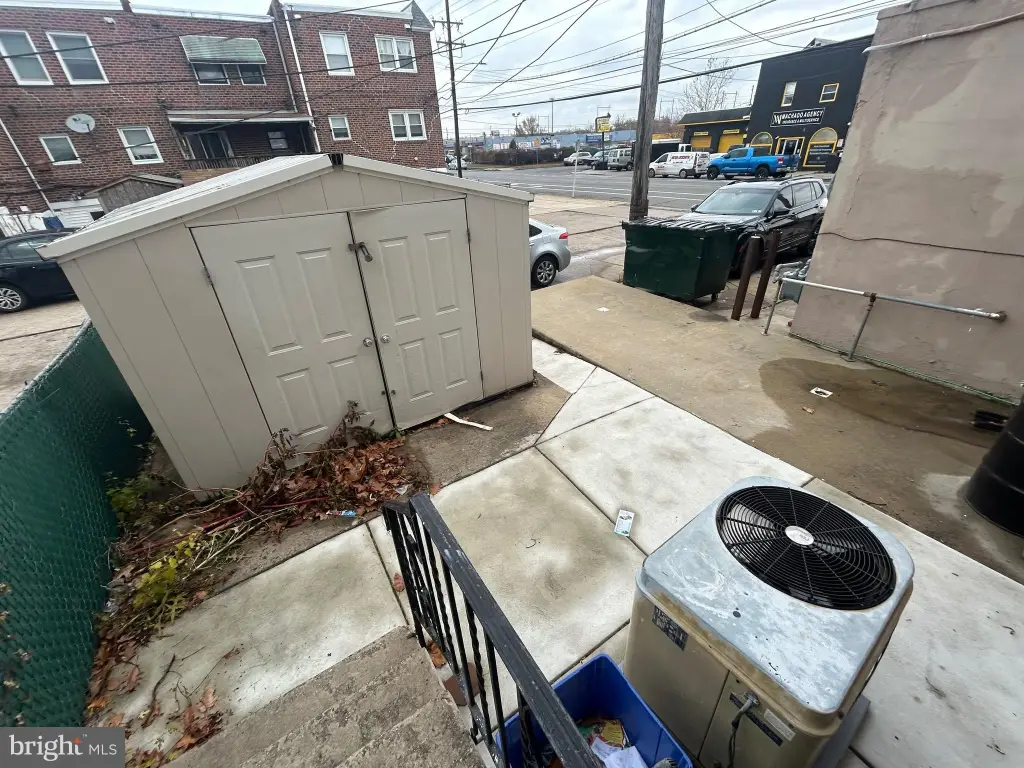
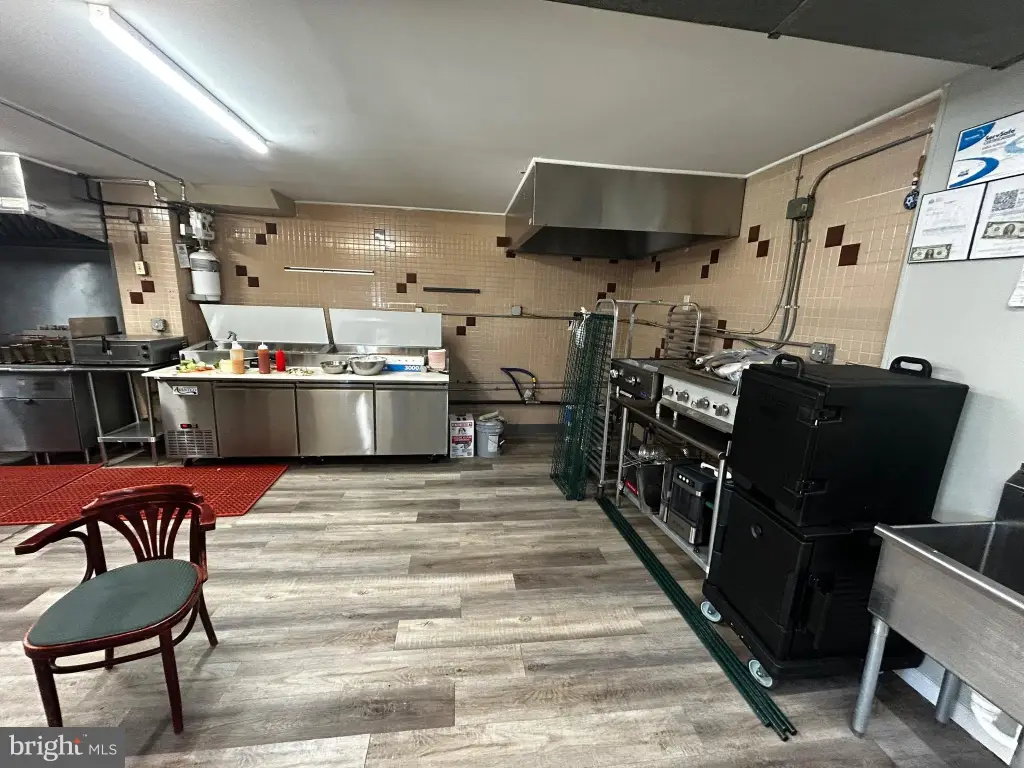
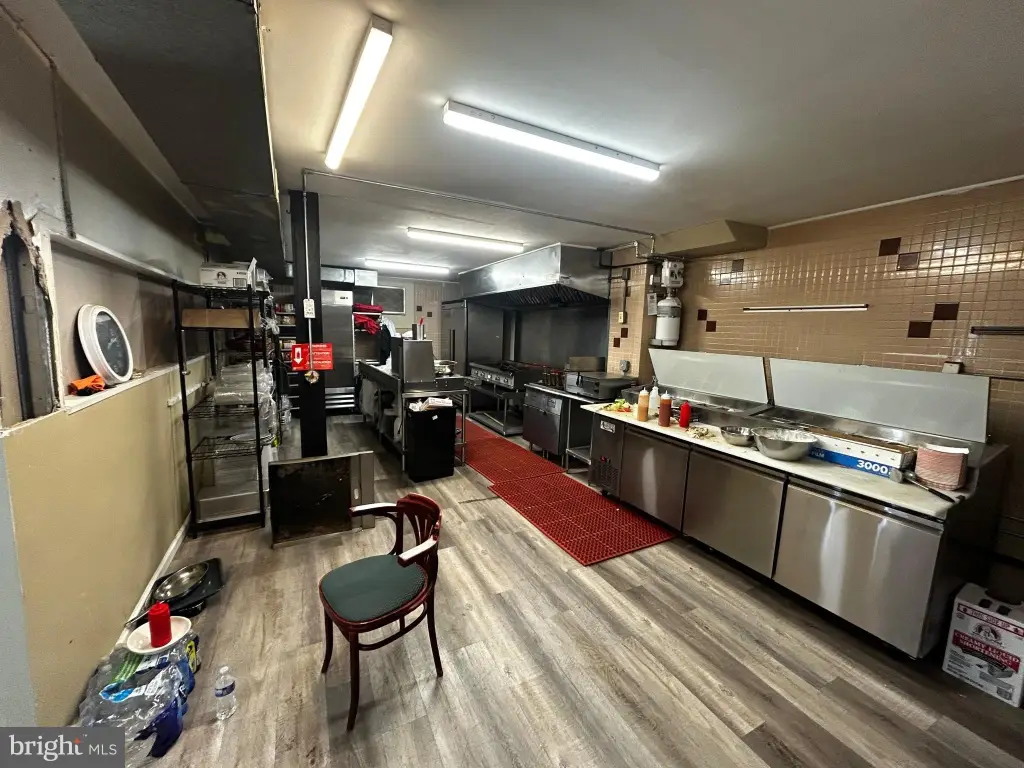
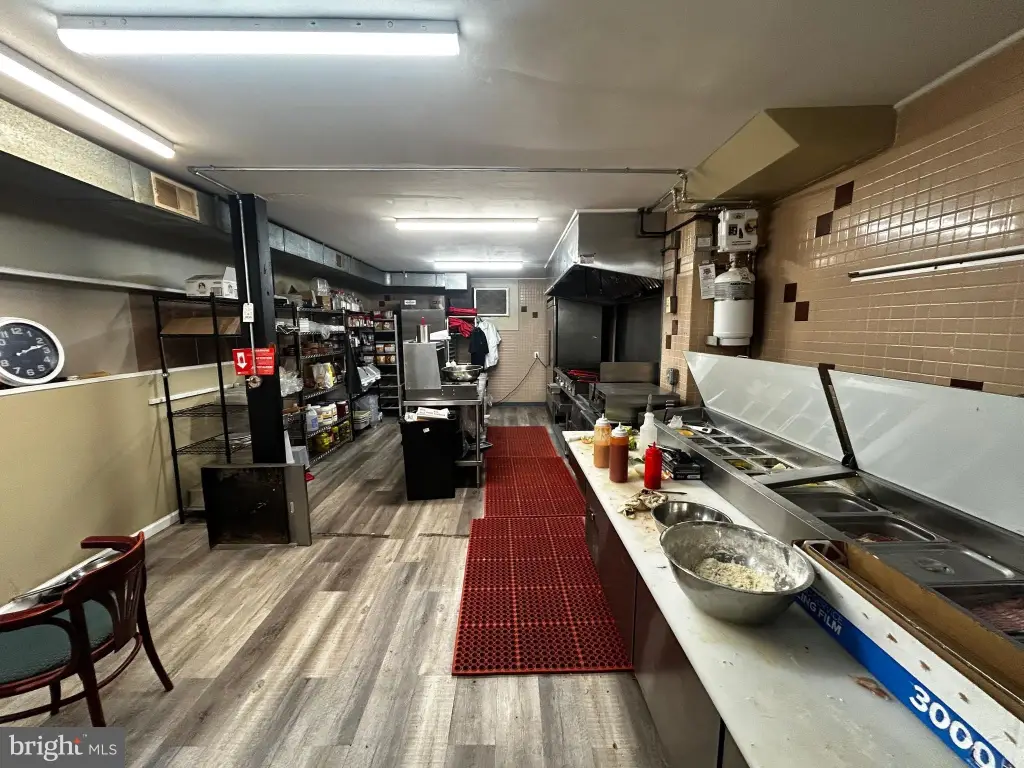
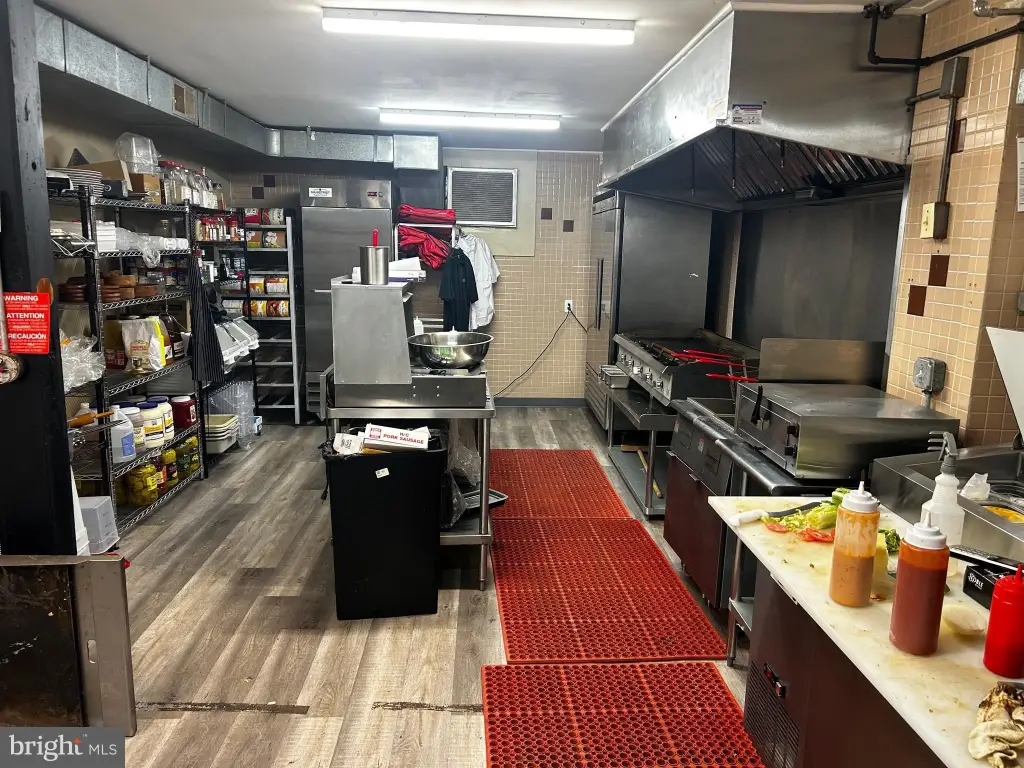
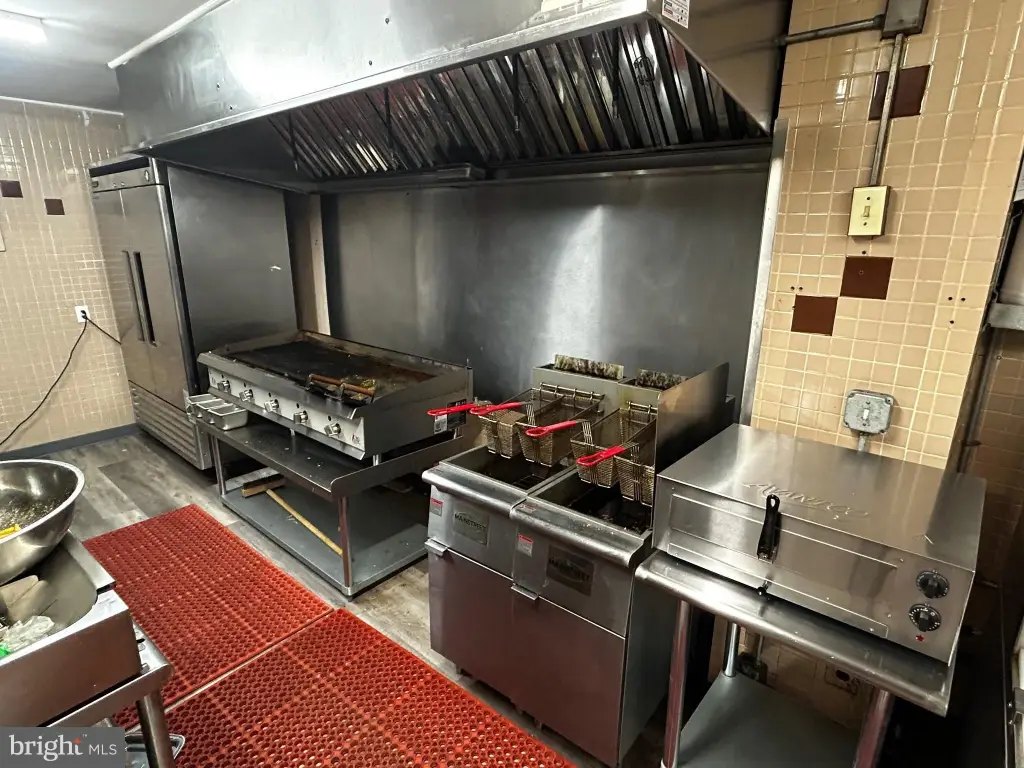
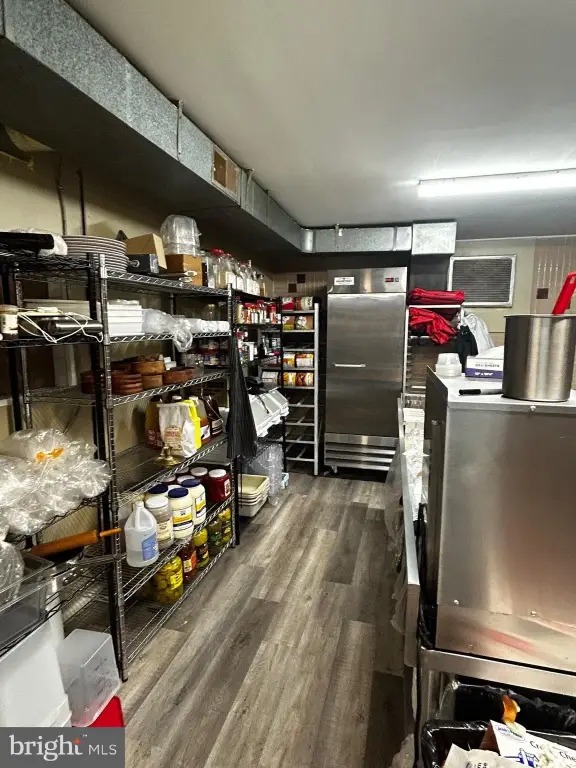
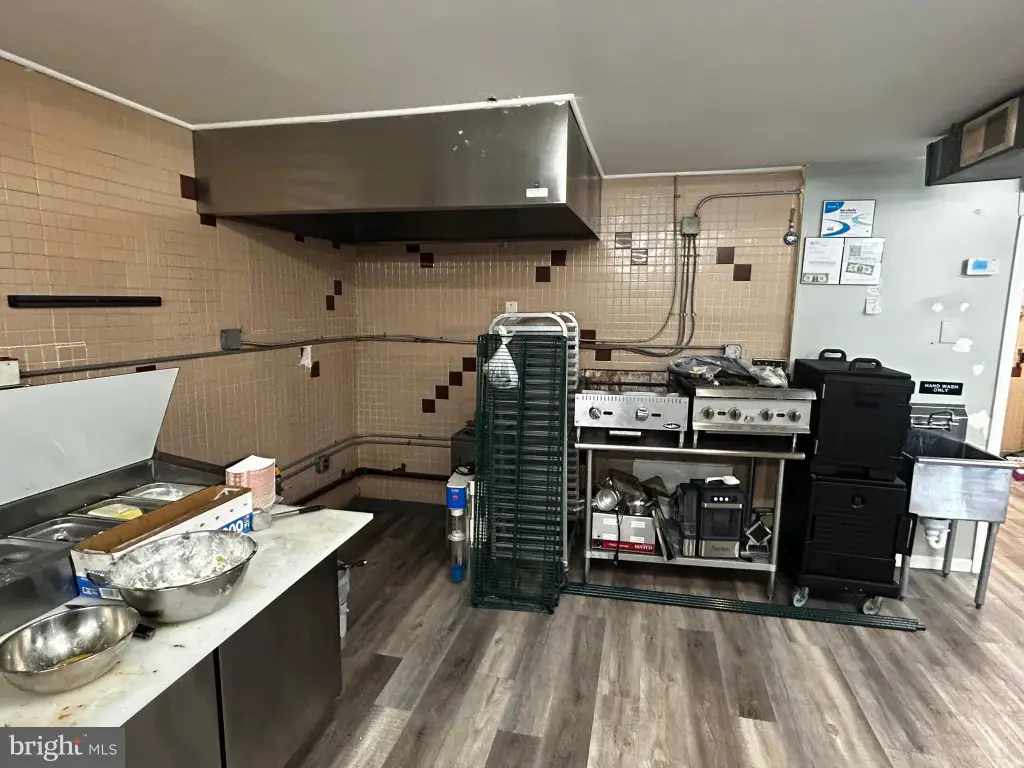
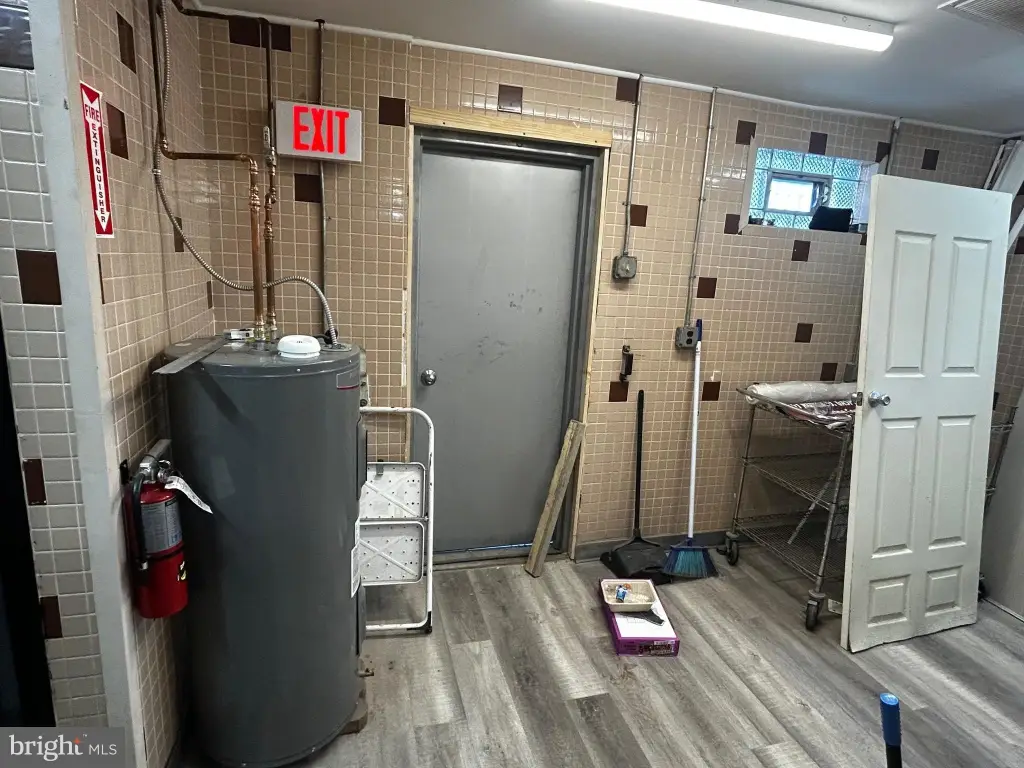
- Corner commercial mixed‑use property in the Holmesburg section of Northeast Philadelphia
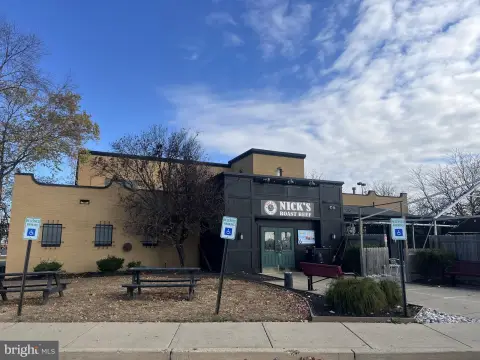
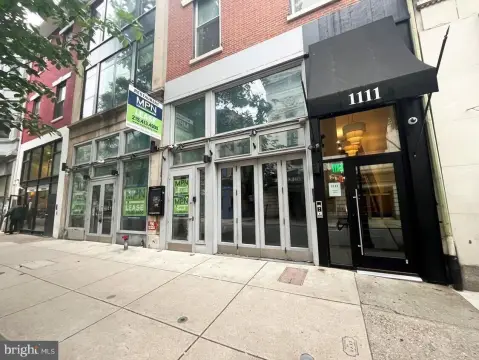
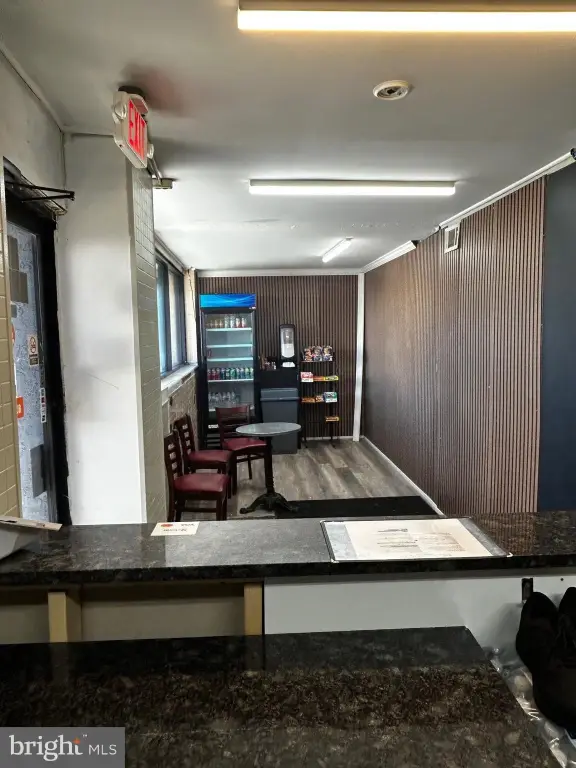
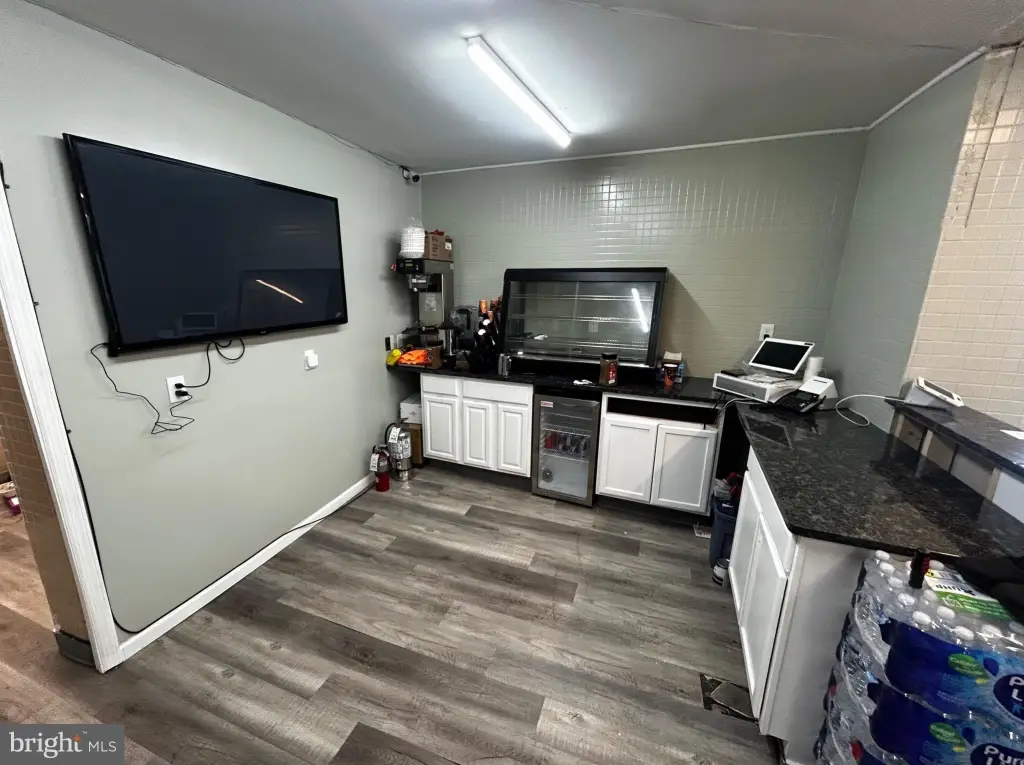
- Commercial space currently leased for $3,000/month
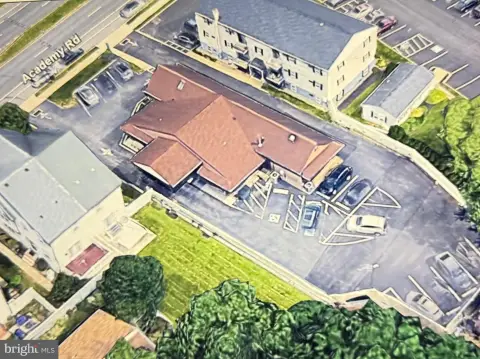
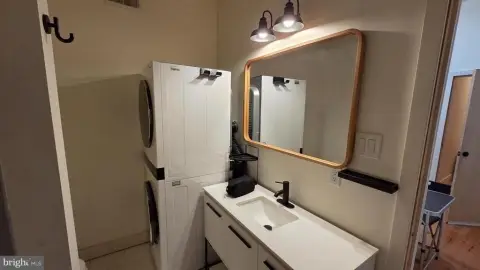
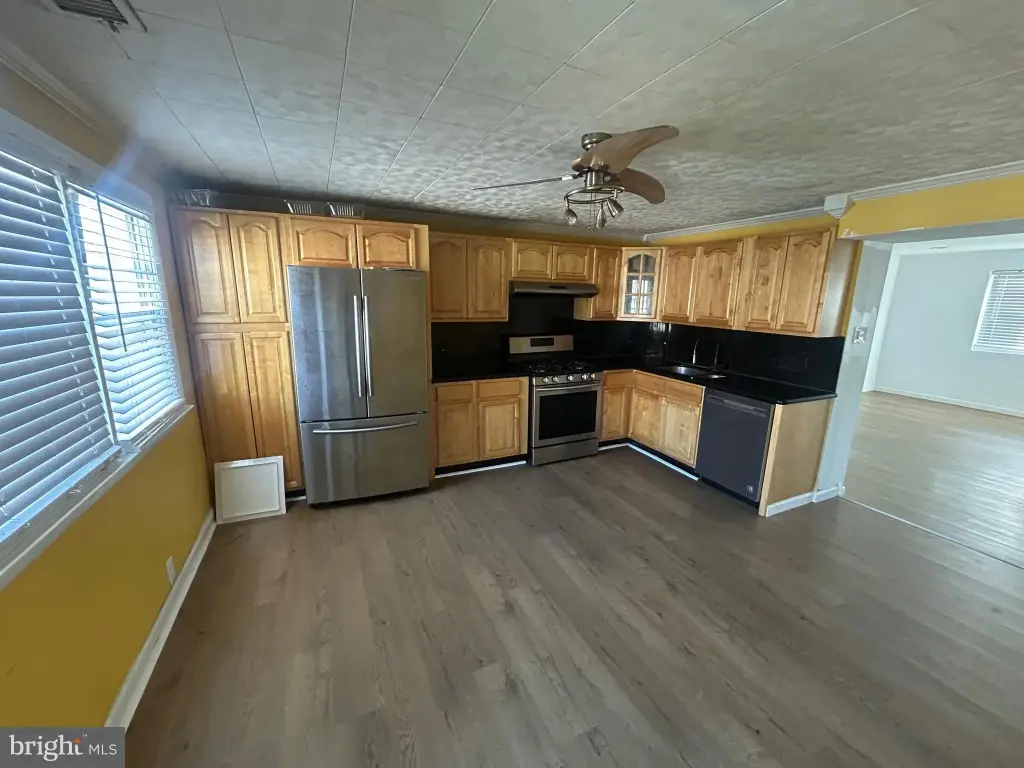
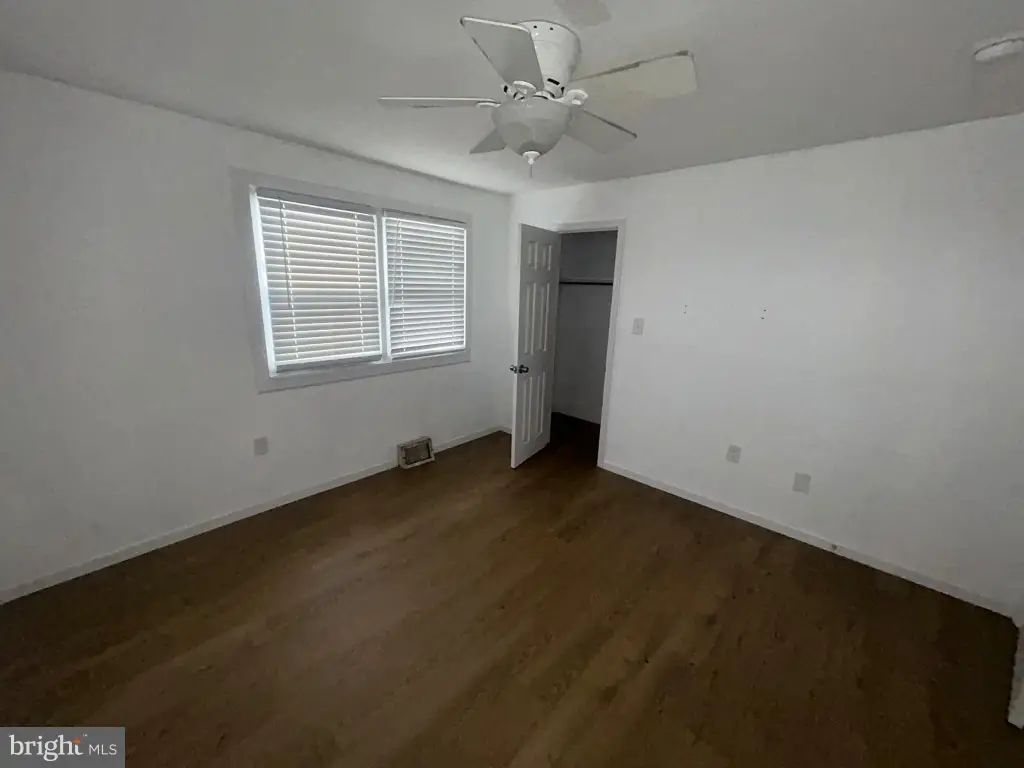
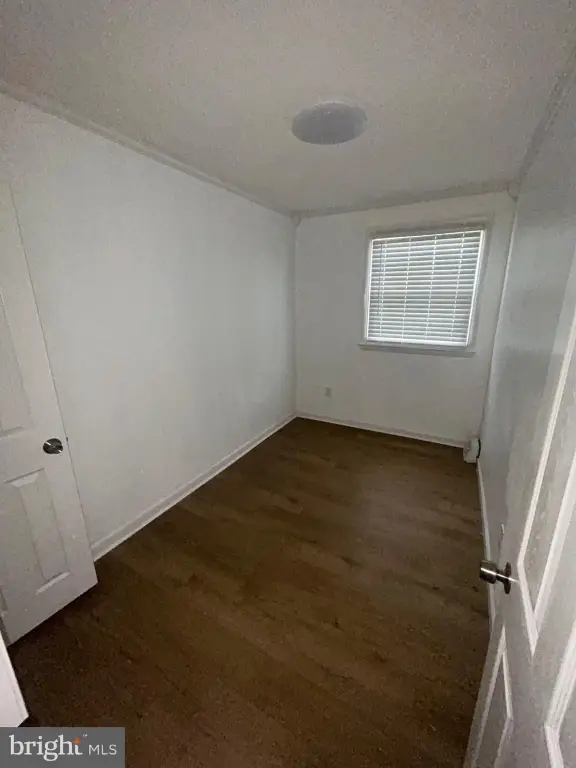
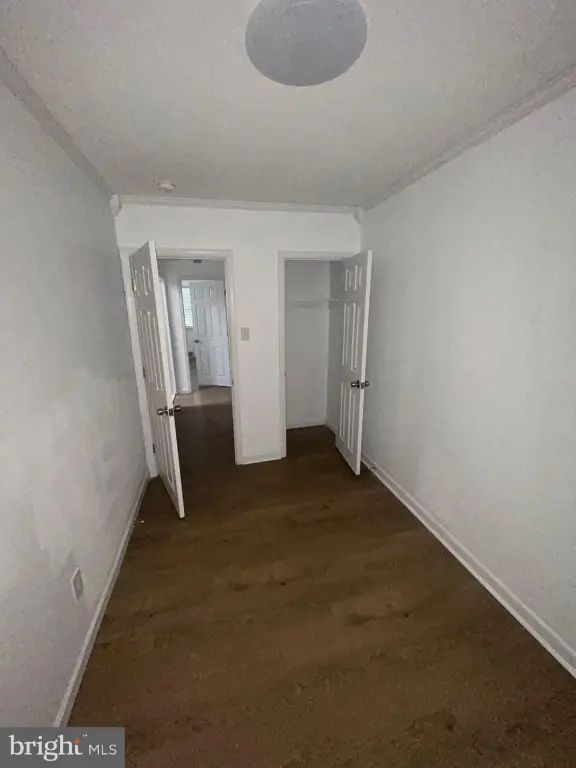
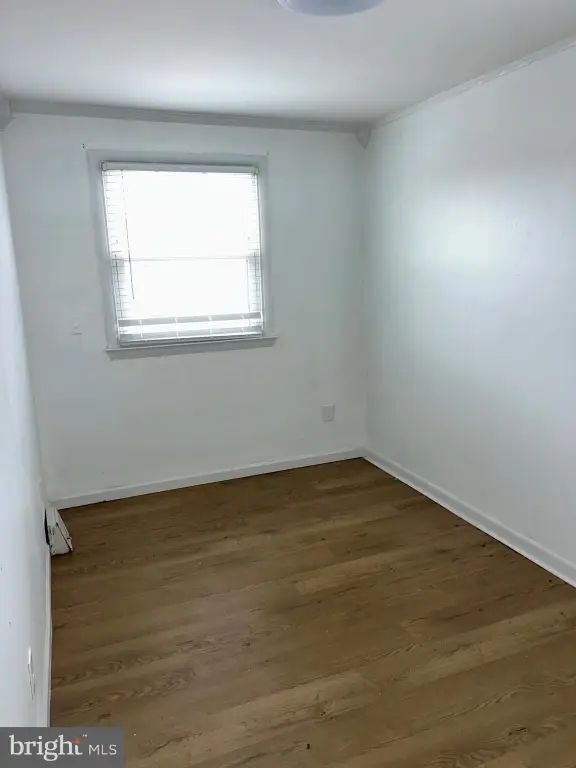
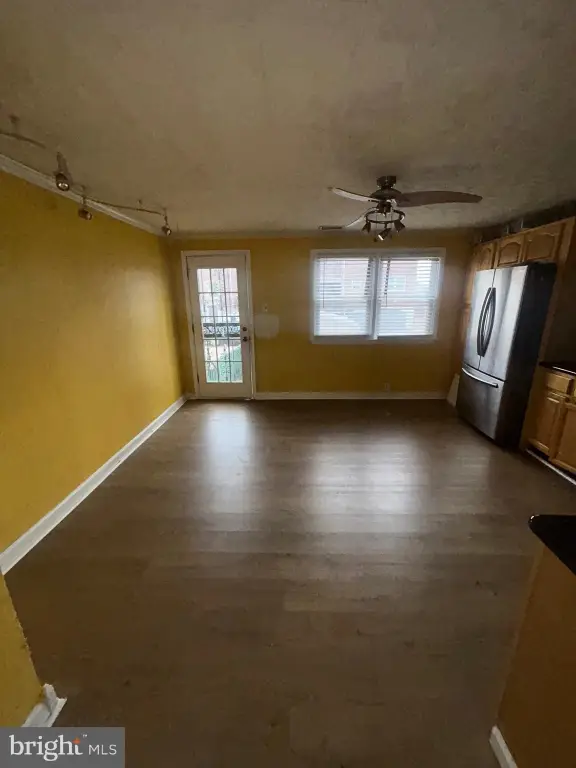
- Separate 3‑bedroom, 1‑bath residential unit leased for $1,800/month
- Estimated 10% cap rate reported in the listing
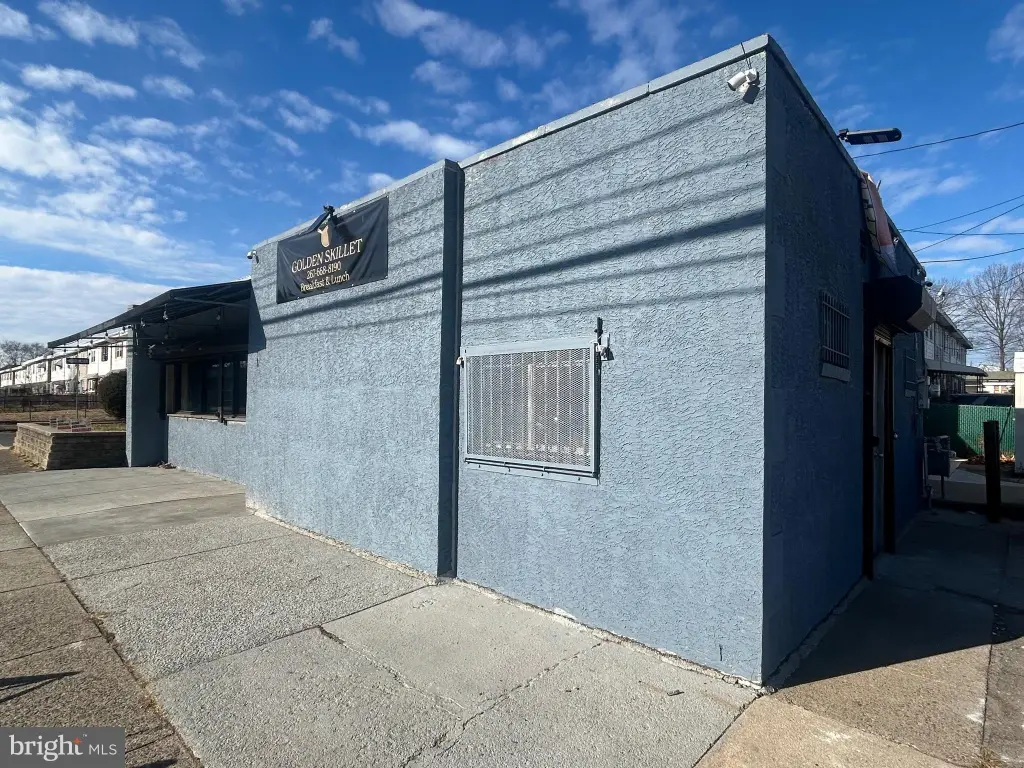
- Masonry construction with forced‑air heating and central air
- On‑street parking
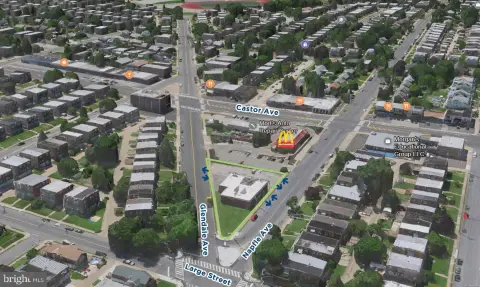
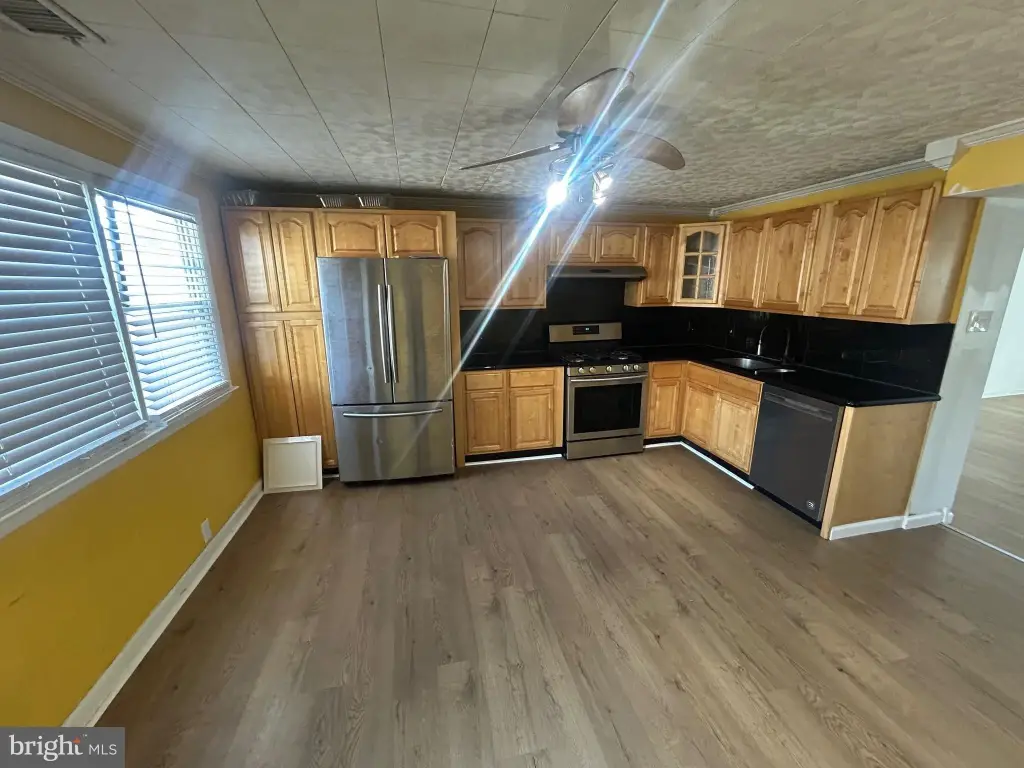
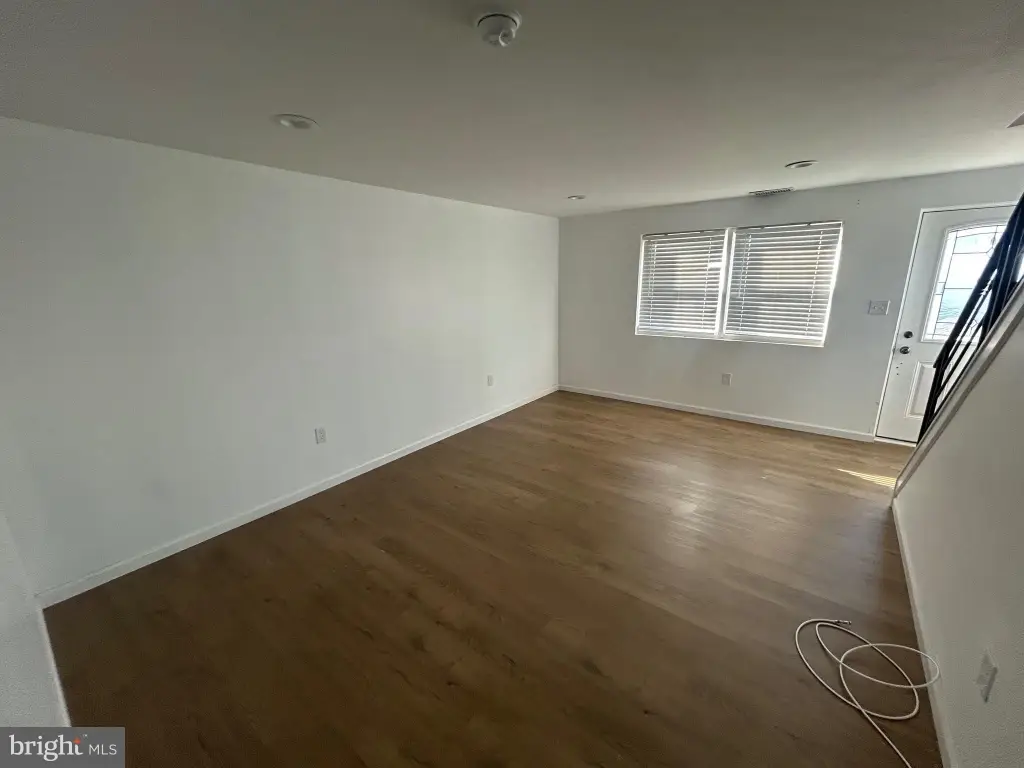
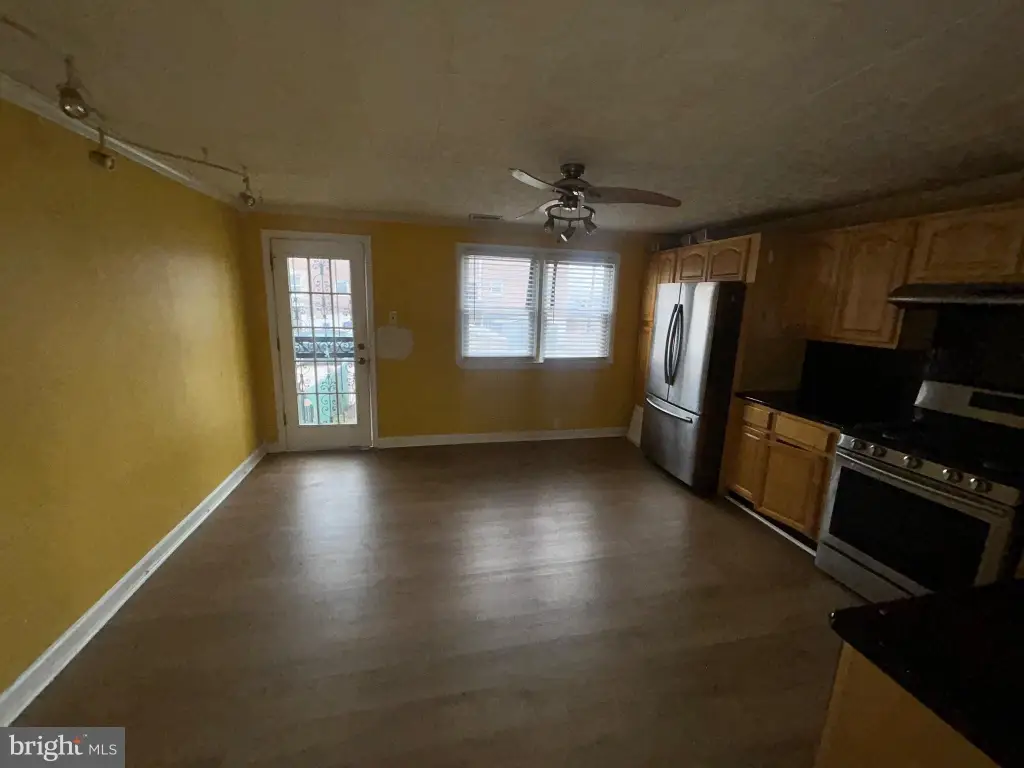
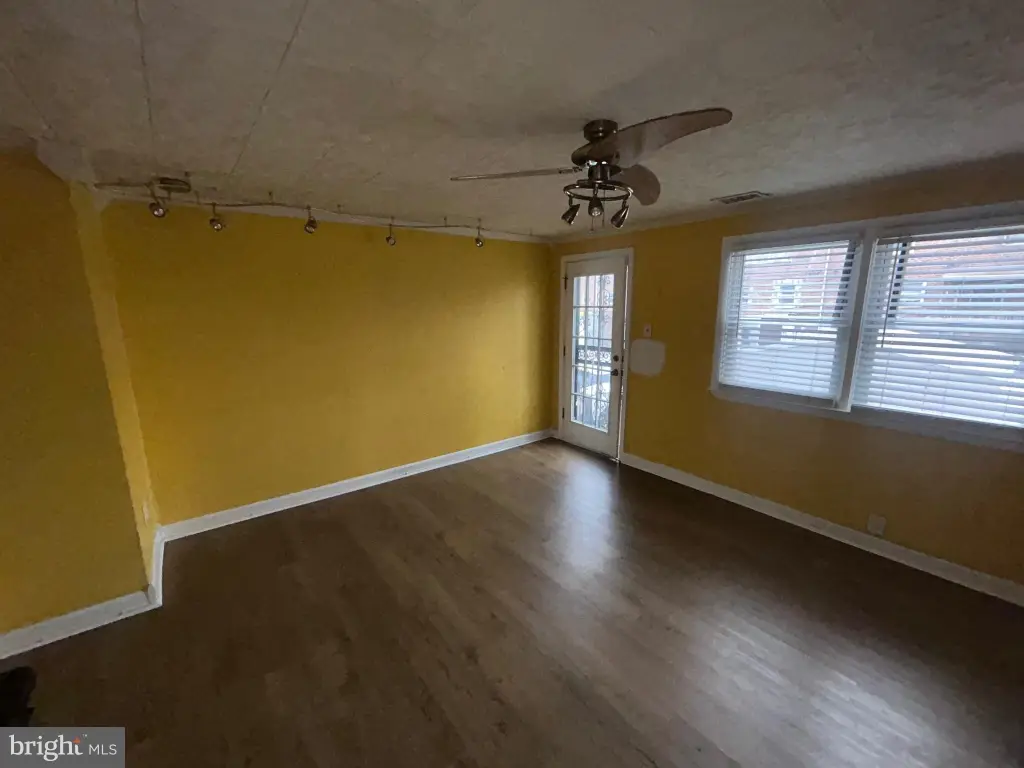
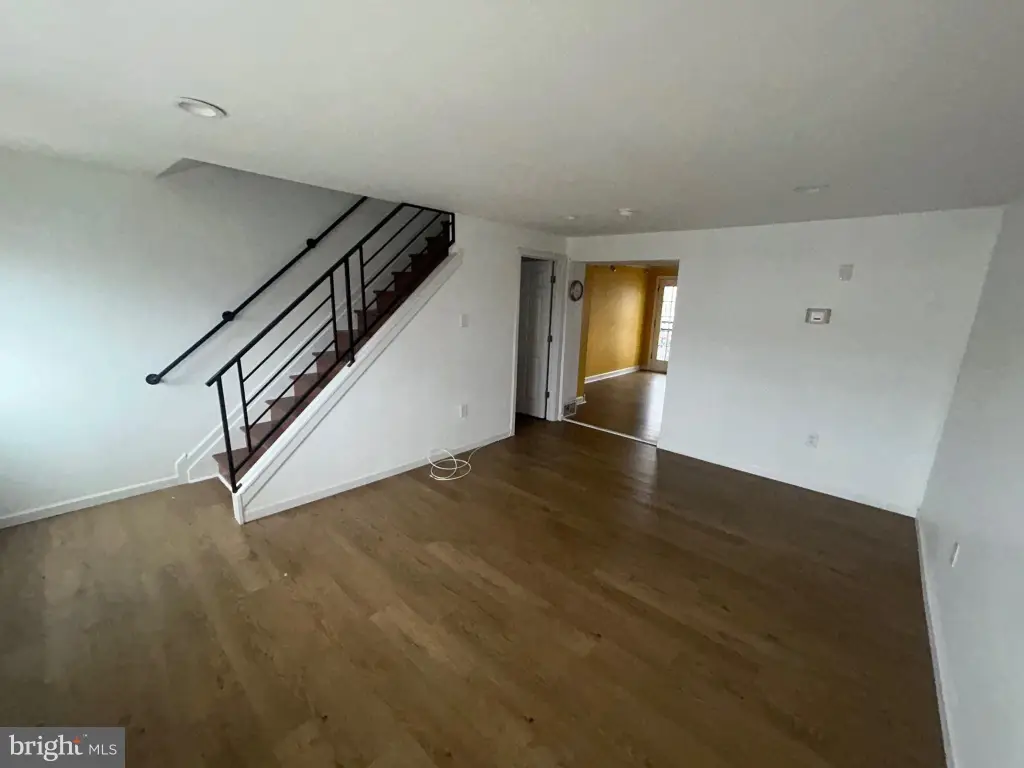
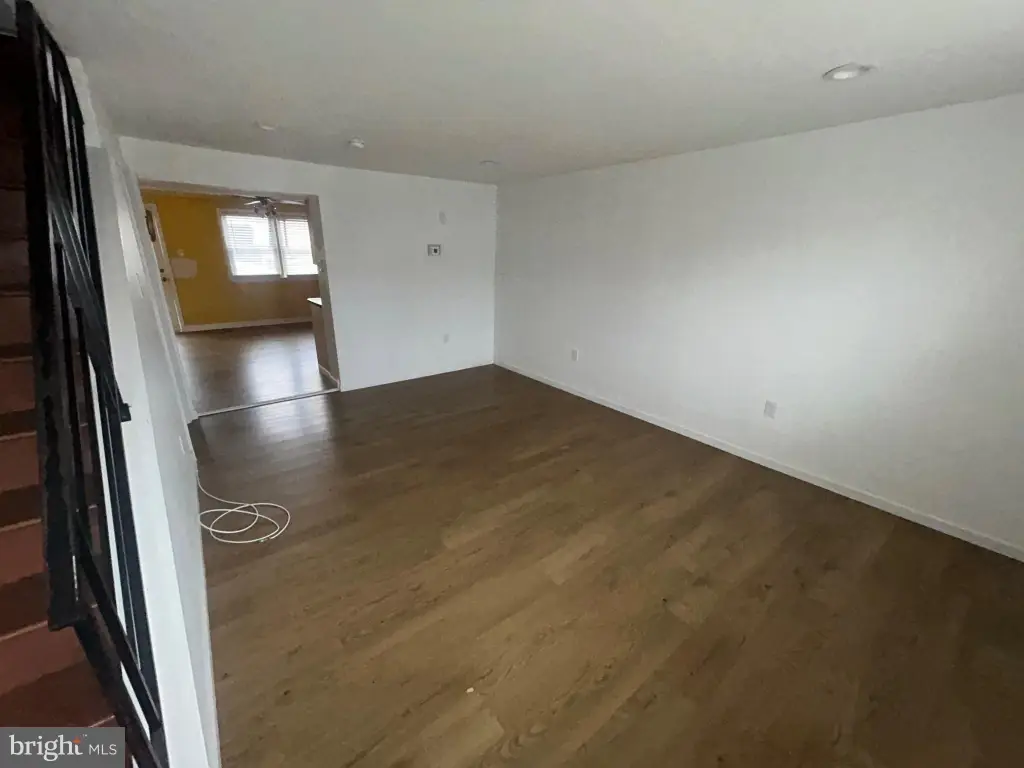
Overview
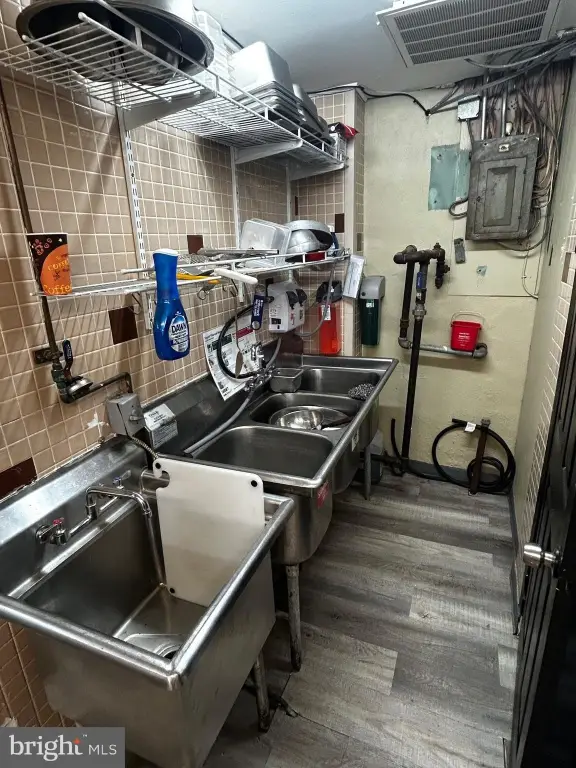
The property is located in the Holmesburg section of Northeast Philadelphia, and it presents as a true combined use building rather than a standalone storefront or single home. With approximately 2,500 square feet of total property area on a 0.0826-acre lot, the configuration supports both an operating business space and a self-contained residence.
From an owner-operator or investor perspective, the layout provides flexibility to market the restaurant and the residence as separate leases. The restaurant space is currently leased for $3,000 per month, and the residential unit is currently leased for $1,800 per month. The listing also cites a 10% cap rate, providing a stated basis for evaluating the property’s income and expenses. Please note that terms, operating history details, and any future lease-up assumptions should be confirmed directly with the current tenant(s) and seller during diligence.
Local Financial Insights For Apartment 5plus
Simulate Cap Rate and NOI
NOI Build-Up
- Vacancy
- income lost from leasable area expected to sit empty during the year — subtracted from gross rent.
- EGI (Effective Gross Income)
- gross rent minus vacancy losses — the realistic income before paying operating costs.
- OpEx (Operating Expenses)
- recurring costs to operate the property (property tax, insurance, utilities, maintenance, management) — excludes financing and capital improvements.
- NOI (Net Operating Income)
- income a property generates after operating costs but before financing and taxes.
| Component | $ | $/SF |
|---|---|---|
| Gross rent | $75.9k | $30.36 |
| − Vacancy | −$4.4k | −$1.76 |
| EGI | $71.5k | $28.60 |
| − OpEx | −$32.2k | −$12.87 |
| NOI | $39.3k | $15.73 |
Alternative Uses
Current Use by Public Records
Location Insight
- Map
- Local Demand
- City
- Philadelphia
- County
- Delaware
- State
- Pennsylvania
- Longitude
- -75.0120087
- Latitude
- 40.0425415